
|
by H. Eiteljorg, II
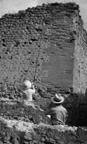
Using CSA's new total station at Pompeii during the month of June was a very enjoyable experience. I operated the instrument with the help of members of the Pompeii Forum Project - initially Karim Hanna, who worked both with the surveying and the on-site AutoCAD modeling but was only able to participate for the first half of the month. Later in the month, Project Director Professor John Dobbins and Professor Larry Ball completed the survey crew. (Mr. Ball was responsible for christening the total station Fred after several of my name suggestions had been rejected.)
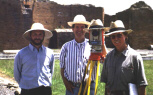 Fig. 1 -
The Pompeii work crew at the end of the season - Mr. Ball, Mr. Eiteljorg, Fred, and Mr. Dobbins.
Fig. 1 -
The Pompeii work crew at the end of the season - Mr. Ball, Mr. Eiteljorg, Fred, and Mr. Dobbins.
The total station included an electronic theodolite with electronic distance measuring device (EDM) and data collector. The data collector, as the name suggests, gathers information from the theodolite and stores it for later transfer to a computer. In addition, the data collector actually drives the theodolite when the system is in use, directing the theodolite to take a reading and pass that reading to the data collector. A program for Windows called WinSURV was used to transfer data from the data collector to the computer and to format the data for transfer to AutoCAD. Fig. 2 shows the instrument with me aiming at a survey point; the data collector has been tucked into my shirt, because that proved to be the easiest way to keep it at hand.
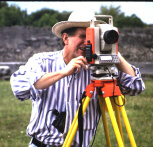 Fig. 2 -
Mr. Eiteljorg using Fred, CSA's new total station. The data collector is tucked into the shirt
because there seemed to be no equally good place to keep it both out the way and and
ready to use.
Fig. 2 -
Mr. Eiteljorg using Fred, CSA's new total station. The data collector is tucked into the shirt
because there seemed to be no equally good place to keep it both out the way and and
ready to use.
No data collector was available to Pompeii Forum Project personnel last year; so the work was much more difficult. All coordinates had to be recorded by hand and typed into the computer. Not only did that slow the process significantly, it also created extra possibilities for error, and I discovered one transposition of the x- and y-coordinates in last year's data.
Almost as important as having the automated data recording was having an automated routine to determine the location of the total station from our known points. Both the new Pentax total station and its data collector (a Corvallis model CMT MC-V) could do that. Last year we determined the position of the total station within AutoCAD during the data transfer process. The process worked but was time-consuming and prone to error. This year I could set Fred up and survey two of our known points. The data collector or the instrument could then calculate the precise position of the instrument and give me an indication of possible error so that I could repeat the process if necessary. (In standard survey work, this may not be very important; points are surveyed and marked with stakes so that the transit can be located above the staked and surveyed points. Needless to say, however, in many archaeological sites, Pompeii among them, one may not pound survey stakes into the ground for future reference; so one must regularly set the instrument up at an unmarked point and determine the location of that point.)
I fought with Fred on several occasions, usually managing at least a draw. The most frustrating and unrelenting problem seems to be one unique to Pompeii. Since the ground on which the city was built includes so much volcanic debris - the famous eruption, after all, was neither the first nor the most violent - the soil is not well compacted. Despite all the tourists who have done their best to beat the earth, it does not provide a stable platform for the very sensitive total station. And Fred needs to be level. On many days it was necessary to try three, four, or even five spots before a stable one could be found. Since the tourists arrived at the site about an hour after the project team, the extra time required to get the machine set up caused great frustration; just as a stable point had been found, the first busload of camera-toting people would arrive and begin to fill the open spaces - and to slow the work. (One member of the Project team or another will appear in tens of thousands of photos of the Forum taken by the tourists who visited the site this June. One of my favorite shirts has wide red stripes; so Fred - signal orange - and I will be very much in evidence in some of those photos.)
Other aspects of the system were problematic, not because they did not function, but in some cases because the processes were still being learned - and in others because the documentation for the data transfer and translation software, WinSURV, was frustratingly meagre. There was, for instance, no instruction manual for WinSURV, just a computer help file. On one occasion I had to call the supplier (in Ohio) from Pompeii to get some answers. Equally irksome, the number of data points that could be recorded in a single file was, for archaeological work, rather small. So the data collector slowed after a few days' work, and the data transfer process became more difficult. A new set of files for the data - but one containing all the basic points for orientation from the old files - had to be created regularly.
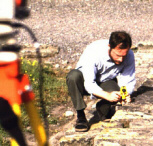
Along with the total station, a new, small reflecting prism was taken to Pompeii this year. (A reflecting prism is required for the electronic distance measuring device to work; the EDM sends a beam to the prism for reflection back to a sensor in the EDM. See article in the CSA Newsletter for August, 1994, "Using a Total Station," for a basic description of the equipment.) This little prism - called a peanut prism - can be placed in a very small bracket that is only a few inches high. The standard prism, on the other hand, sits atop a pole that is at least a meter and a half high. The difference can be quite important for precise survey work, because it is surprisingly difficult to hold the standard prism pole steadily, even without wind or other unusual problems. The little prism, on the other hand, can be held very steadily without much trouble. (See Fig. 3 for a photograph of the peanut prism on its bracket and Fig. 4 for the standard prism and pole.)
 |
 |
| Fig. 3 Mr. Ball holds the peanut prism in its bracket for a survey shot. |
Fig. 4 Mr. Ball holds the standard prism and pole for a survey shot. |
Since the operator of the instrument must aim precisely at the center of the prism, the difference in steadiness can be important. (When possible, I aimed first at the tip of the prism pole if we were using the large prism or at the tip of the bracket if we were using the peanut prism. Precise aim on that point accurately established the horizontal angle; so I would not adjust the horizontal swing thereafter. Then I would aim at the center of the prism, but adjust aim only for rise and fall. Using that method, only the movement of the prism toward or away from the machine would affect accuracy.)
The small prism could also be removed from the bracket and used directly against a wall. It had a conical projection at its rear, the tip of which marked the exact point surveyed. Putting the tip of the prism against a wall point, then, allowed that wall point to be surveyed.
In addition to the small prism, targets with reflecting tape were used this year. The targets were large and easy to see, and reflecting tape was placed on them, with a hole cut in the center of the piece of tape so that the center of the target could still be seen through the transit telescope, permitting good aiming of the transit. (Testing showed that, at close range, these targets provide the same results as the peanut prism.) The targets provided few advantages for normal shots, but they were useful when points for surveying had to be included in photographs. The targets could be placed in an area, surveyed, photographed, and removed for re-use. They were made large enough that they can be seen easily in photographs, even in the negatives. (The targets' positions could be surveyed by one person working without an assistant.)
Targets without reflecting tape were also used. When they were included in a photograph for photogrammetry, we could survey the target position with the peanut prism.
The use of targets and photographs permits details from photographs to be surveyed for use in the models, as if they had been surveyed in the field. (The November, 1994, issue of the CSA Newsletter contains details about the functioning of the single-photo photogrammetry system used; readers unfamiliar with the technology may wish to refer to "AutoCAD Single-Photo Photogrammetry at Pompeii," p. 3.) We used photogrammetric methods again this year, and there will be a separate article about that technology in the next issue of the CSA Newsletter.
Reflecting tape had also been used last year at Pompeii. We found that we could place a piece of tape against a wall and take a good reading. We had to aim first at the correct point and then place the tape on that point. Using the peanut prism made it unnecessary to use the reflecting tape in that way, but when the team began work on the Eumachia building, which has a very complex facade, the reflecting tape was pressed into service in a new way. There are two apsides on the facade of the structure, and each survives to a considerable height. In addition, there are niches that are well preserved but partially filled with ancient mortar that was meant to form a setting bed for a marble revetment. For both the niches and the apsides, reaching to positions for which survey information was needed proved to be impossible without complex scaffolding. But the data would have been seriously incomplete without the coordinates of some of those points. Mr. Ball suggested using the fishing pole (used by Mr. Ball and Mr. Dobbins to position a tape measure in difficult-to-reach places) to put reflecting tape against survey points on the building in the otherwise unreachable points.
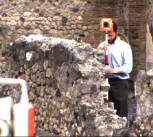
So Mr. Ball and I fashioned a bracket for the end of the pole (using the high-tech equipment at hand - a wire coat hanger, a thin plastic card, and duct tape) and affixed a piece of reflecting tape (Fig. 5). The reflective tape could then be placed against the wall anywhere the pole could reach, and the wall immediately behind the tape could be surveyed, as shown in Fig. 6. In practice, I first aimed the theodolite at the point to be surveyed, then the reflective tape was put in the proper place, and then a reading was taken.
 |
 |
| Fig. 5 Device for placing reflecting tape on a survey point. |
Fig. 6 Mr. Ball holds the fishing pole with reflecting tape device on a point to be surveyed while Mr. Dobbins directs him to the proper spot. |
We are working on a more sophisticated version of this device We plan to include a scale on the edges so that one can read through the telescope the distance between two measured points or between a measured point and the tip of the device. Indeed, it should be possible, when one cannot take a direct reading of the tip of the device, to read two points on the device and calculate the position of the tip. (For a description of the new, improved device, see "New Survey Aid" in volume 9.1 for May, 1996. ).
A good example of the use of this device comes from our survey of the profile of the cornice on the Sanctuary of the Genius of Augustus. The cornice is about 5 meters above the ground, but, with the aid of a ladder, the fishing pole, and the new device, Mr. Dobbins was able to place the reflecting tape on the cornice while I aimed the total station. The drawing shown here as Fig. 7 resulted from that work. We have no independent check of the accuracy of the drawing, but we all agreed that the profile appears to be very accurately drawn.
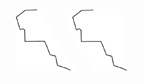 Fig. 7 Cornice
profile from the Sanctuary of the Genius of Augustus at 1:4 scale. The cornice was surveyed with
total station and reflecting tape device. The drawing on the left was imported directly from
AutoCAD; the drawing on the right is the same profile, with curves rather than straight line
segments on the underside of the hawksbeak.
Fig. 7 Cornice
profile from the Sanctuary of the Genius of Augustus at 1:4 scale. The cornice was surveyed with
total station and reflecting tape device. The drawing on the left was imported directly from
AutoCAD; the drawing on the right is the same profile, with curves rather than straight line
segments on the underside of the hawksbeak.
[In general, users cannot test the accuracy of instruments like these, but the repeatability of measurements can be checked. We did check repeatability this summer and were very pleased, getting results that indicate that the equipment and we who used it functioned correctly.]
As the season progressed, the problems with the WinSURV software became more troublesome. New data sets had to be created with some frequency, and the data for the basic orientation points - the starting data required for all the Pompeii survey information - had to be included in each new set. Unfortunately, though, the system often failed to use the orientation points automatically, and they had to be entered manually in the computer file.
I talked with the suppliers after returning from Italy. It seems that a solution can be found, but it will require some care and will complicate the process, requiring that a core file with the orientation points be maintained, copied, and used as the base for each subsequent working file of survey data. Any new orientation point must be surveyed in the core file, not the working file. This is unfortunate, but its effect on the utility of the system is minimal.
All in all, the machine had a very successful debut, and we were all more than pleased with the added productivity it brought to the work at Pompeii.
For other Newsletter articles concerning the applications of CAD modeling in archaeology and architectural history or Pompeii, consult the Subject index.
Table of Contents for the August, 1995 issue of the CSA Newsletter (Vol. 8, no. 2)
 Table of Contents for all CSA Newsletter issues on the Web