
|
In April of 2004 the CSA Propylaea Project carried out one more survey experiment. For this experiment a Cyrax 3D scanner was used (operated by an Athenian company experienced with the scanner, Tension, S.A.). This scanner operates much like a total station except that it aims and "shoots" with internal mirrors that automatically rotate to take up to 1,000 readings along both horizontal and vertical axes. A single set of readings may include as many as 1,000,000 individual readings (a grid of 1,000 by 1,000 points). The machine can be set up at multiple spots within an area, and with surveyed targets included to provide absolute locations as well as the necessary fixed points to relate each set of readings to the others.
First a word about measuring in general. Taking relatively short measurements with a tape measure from point to point provides good, repeatable results. Even with such simple and direct methods, however, there are potential pitfalls such as temperature shifts that may cause metal tapes to shrink or stretch. Measuring in three dimensions, on the other hand, requires controls and methods that, in the real world rather than a lab, make absolute accuracy and tight precision virtually impossible. (This is not the place for a discussion of the difference between accuracy and precision -- or the difference between accuracy and repeatability. For a discussion of these issues, see The CSA CAD Guide for Archaeologists and Architectural Historians, Chapter II, "Precision, Significant Digits, Accuracy, Repeatability, and Calibration" at http://www.csanet.org/inftech/cadgd/cadgdtwo.html#ch2.1.) There is, indeed, no standard we can point to that is infallible for three-dimensional measuring, no measurement system that will produce absolutely accurate results to high precision in real-world use and that can, as a result be used as a true standard for comparison.
It is therefore difficult to compare measurements from one system with those from another and state with certainty what the comparisons mean.
Nevertheless, it seems that the most accurate and precise 3D measuring system available for use for archaeological projects involves the use of theodolites. The most modern version of that venerable instrument is the total station that provides both an electronic determination of angles (to very high tolerances) and a direct measurement from the instrument to the target.
One of the advantages of using a total station -- and one of the disadvantages -- is the fact that using it may rely upon someone placing a target at any point to be surveyed. (Targets can be eliminated, but problems arise without them. See "Surveying the Northwest Wing of the Propylaea -- A Pilot Project Project," CSA Newsletter, XVI.1 [Spring, 2003].) That means that all points are, at least in theory, properly identified by someone who knows what points are important. It also means that there is no problem with photo-interpretation or any other form of visual discrimination in the process of identifying the point to be surveyed, whether on a computer screen or paper drawing/photo or in a 3D viewer. (It also means that secondary points can often be measured with a tape quickly and easily. There are certain difficulties with doing that, but they can be overcome.)
It should be clear to all, despite the foregoing, that the total station will not produce results that are free of error. For instance, in the south wall of the NW wing of the Propylaea are two blocks resting on one another. Surveying with a total station, CSA personnel located the right, top corner of the lower block at a point higher than the bottom corner of the block resting on it by .002 m.; the left, top corner of the lower block is 1 mm. higher than the bottom corner of the upper block. The measurements for the two blocks were taken on different days with different set-up conditions, and that explains the slight discrepancy, but the point is that this system is not -- and should not be expected to be -- capable of producing absolutely correct coordinates of all points in an area. There will be small but real differences between what is surveyed and the reality, sometimes caused by mis-placing the target or prism, sometimes by allowing the instrument to deviate from level by a miniscule amount, sometimes just by rounding error that makes a .0002 m. difference into a .001 m. error.
This introduction has been included so that the comparison of total station and 3D scanner results can be taken as what they are, comparisons of two systems, one of which is believed to provide a standard for comparison, but that is a belief born of the total station's relative superiority, not its absolute accuracy.
Total station methodology was based on identifying corners of blocks either by finding the corner and placing a target there, by interpreting the location of the corner with the target (clear plastic with a cross-hair) placed to put the cross-hair at the point where the now-eroded corner once was, or by interpolating the corner location by separately surveying x, y, and z coordinates of the corner from appropriate nearby points. In some cases a target could not be placed at the point to be surveyed; so a tape measurement was made from a survey point to the real point. In those cases, the surveyed point was either vertical or horizontal to the actual point. (In this case, that means along a joint or along another ancient line that was intended to be vertical or horizontal.) This was commonly done with the beveled surfaces connecting one surface of a wall block to another. Interior corners were generally measured, not surveyed, with the depths separately surveyed. (For more about the total station techniques, see "A Final [sic] Survey Experiment on the NW Wing of the Propylaea," CSA Newsletter, XVI.3 (Winter, 2004); http://www.csanet.org/newsletter/winter04/nlw0401.html.
Survey data were taken directly from the total station data recorder, translated into another coordinate system, and then entered into the CAD model. The measured points were added in the modeling process. The resulting model is a surface model; that is, 3D surfaces are created, not lines in space. The corners of those surfaces - the points originally surveyed or interpolated - were used for comparison purposes.
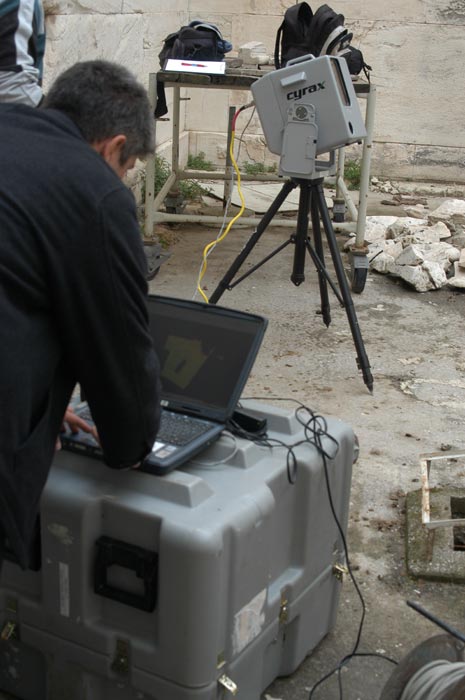
Fig. 1 - The Cyrax 3D scanner (background) with connected computer in the Propylaea.
3D scanner methodology was based on the use of the scanner data (multiple scans yielding about 8 million data points on the south wall in a data form known as a point cloud) in software created by the scanner manufacturer (Cyra, now a division of Leica). The software permits a skilled user to locate discontinuities in the scanned points and to identify blocks from them. Use of this software clearly requires experience; so the work was done by an experienced technician employed by Tension S.A. in Athens. (CSA Director Harrison Eiteljorg's attempts to survey with the software were frustrating and not productive.) The technician created a CAD model with outlined the blocks in the area of interest and with lines to mark internal features of blocks. The result did not normally include explicit locations for block corners since they were so often eroded; therefore, the corners were interpolated in the CAD model (at the CSA offices) either by using the nearest relevant points (elevation from one, width from another -- depth was always found to be the same) or by extending lines to form relevant corners. Those corner points were used for comparison purposes. It should be noted that the technician produced AutoCAD® polylines, which are constrained to a single elevation; therefore, there may be some anticipated problems with the depths of points (treating the wall surface as the x-y plane).
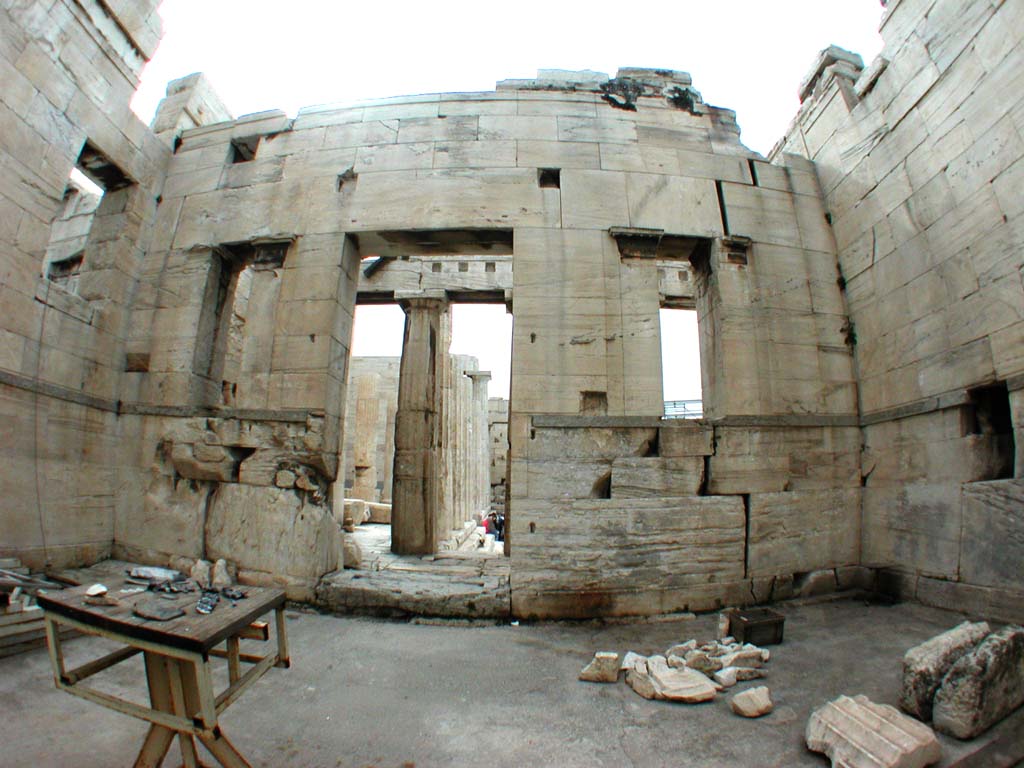
Fig. 2 - The interior south wall of the NW wing of the Propylaea. Because of the size of the space, an extreme wide-angle lens was required to get the whole wall into a single photograph. As a result, there is considerable distortion.
For cost reasons, only a small part of the south wall was modeled from the point cloud data. Ten blocks above the so-called string course on the west side of the doorway were chosen for modeling because of their position (not too high and therefore not scanned from an extreme angle) and their generally good state of preservation. The blocks were also selected because they have protrusions for the framing of the window in that part of the wall as well as recessed peritenia surfaces. They provide many points of interest for the surveyor.
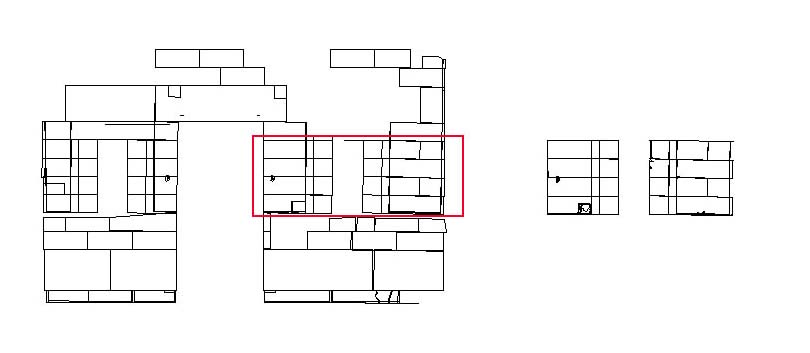
Fig. 3 - The CAD drawing of the south wall as produced from total station data (left) and the 3D scanning data (right), with red outline showing common portions.
The results of the two surveys of the ten blocks can be visually compared in a CAD model, but scale makes the comparisons difficult to make -- and very difficult to quantify. In addition, it is virtually impossible to make certain that the coordinate systems are precisely aligned since the models used different methods and points for selecting the principal axes.
Therefore, it seemed more appropriate to compare internal dimensions -- distances from point-to-point in the models, not point coordinates. This is a safer and more fair method, since it treats the sets of data independently and makes internal relationships the critical ones. To compare dimensions fairly, a selection of points was made, and the points chosen were those that could be clearly and unambiguously chosen. The same points were chosen from each model, the model made from total station data and the model constructed from 3D scanner data.
A spreadsheet was created. There were 108 matched points chosen from each model. All 108 point coordinates from each model were exported from AutoCAD and imported into the spreadsheet. The distances from all 108 points in each model to every other point in that model were calculated for both the total station coordinates and the 3D scanner coordinates. The common distances were then compared to one another, with the distances carefully paired to be certain that the same points were used for each comparison. Given the number of points, there was a very large set of numbers for comparison -- more than 5800 point-to-point dimensions.
The results are as follows (all numbers in meters):
| Average (mean) difference between total station and 3D scanner measurements | 0.0046 |
| Maximum difference | 0.0172 |
| Minimum difference | 0.0 |
| Median difference | 0.00401 |
| 1 standard deviation from the mean | +/- 0.00326 |
| 2 standard deviations from the mean | +/- 0.00653 |
| 3 standard deviations from the mean | +/- 0.00979 |
(The distribution curve in this case is not a "normal" one. Half of the samples lie in a range of 0 to .00401, a range of only .00401 in total; the other half in the much larger range between .00401 and .0172, a range of .0129.
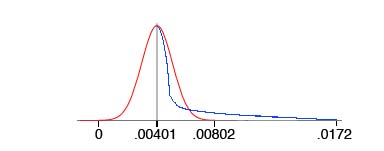
Fig. 4 - This simplified graph shows a normal distribution curve (red) compared to the distribution of the results in this experiment (blue). In each case half the results fall to the left of the .0401 mark and half to the right, but many of those to the right in the blue curve are farther from the median.
Were the distribution normal, the statistics would indicate that two-thirds of the measured distances fall within .00786 m. of one another, roughly 95% fall within .01113 m. of one another, and 99.7% within .01439 m. of one another. The actual distribution is skewed and makes the interpretation of those numbers somewhat atypical. (It is noteworthy that there were 416 differences larger than .01 m. - 7.14% of the total compared dimensions.)
It seemed likely that the differences between the two sets of dimensions might be heavily influenced by less accurate readings of depth (relative to the wall plane); so a separate spreadsheet was generated to examine that dimension only. Only about 2100 of the comparable dimensions were studied. The results were as follows for dimensional differences in depth only:
| Average depth difference | 0.0029 |
| Maximum depth difference | 0.0115 |
| Minimum depth difference | 0 |
| Median depth difference | 0.0025 |
These numbers suggest that the differences are not primarily depth-based but are more broadly based on all coordinates. In addition, out-of-plane errors would have relatively less impact on the point-to-point distance differences.
| Scanning: | |
| On-site scanning (not including CSA Director's time) plus obtaining data points from point clouds: | $ 8,280.00 |
| Estimated time to create surfaces to match CSA needs: 4 hours | 160.00 | Total | $ 8,440.00 |
| Total station: | |
| On-site work crew & surveying (not including CSA Director's time): | $ 6,893.00 | Personnel time translating data and building the model (rough estimate): 120 hours | 4,800.00 | Total | $ 11,693.00 |
(CSA personnel work calculated at $40 per hour on the assumption that some of the more difficult work would require an employee with a very high hourly wage, but the more routine AutoCAD work could be done by someone who could be employed for substantially less.)
These figures are only suggestive; they are not truly comparable. The 3D scanning was only for the south wall. While scans of the east wall would not have required a doubling of the time on the Acropolis, they would have added significantly to the time spent. The work with the scans to produce the drawing included some work on blocks other than the 10 blocks actually modeled, but, even so, the drawing produced from the 3D scans amounted to only small fraction of the work done with the total station on the blocks of the two walls.
The on-site of the total-station crew and surveyors was for doing both the east and the south wall, but neither wall is complete. Points were missed and others were never reached. The time spent in the CSA offices translating data would have been little changed by very large changes in the number of data points.
First, it seems that the problem inherent with scanning as a technique are evident here. One does not choose the points surveyed with a scanner as one does when working with a total station. One can only use the points that happen to have been scanned. Therefore, surveying a specific point is a matter of getting coordinates for the scanned point closest to the one sought. This problem necessarily introduces significant, pseudo-random error. (Under some circumstances it might be possible to interpolate, but one would require a visual check not available in the current system.)
Second, the system is heavily reliant on a skilled technician for interpreting the point cloud data. That is not unique; total stations require skilled operators as well. It seems, however, that the skills are somewhat more difficult to gain, and they require significant practice -- not to work quickly but to work at all. Furthermore, a skilled and experienced technician is unlikely to have experience with the building under study. Whereas several people might know the building well enough to be sensitive to particular issues affecting measurement, the technician did not have -- and could not be expected to have -- such familiarity with the structure. Photographs cannot supply that familiarity, and photographs are the only reasonable means of expressing to the technician the nature of the survey subject.
Third, at least in the current iteration of the scanning system, the absence of linked high-resolution photographs reduces the system's effectiveness.
Fourth, the great advantage of the 3D scanner is the ability to obtain data from a distance without anyone needing to select the survey points in advance. CSA's October work with the total station was not completed because points were missed for one reason or another and some points could not be reached. By comparison, the use of the scanner -- presuming complete coverage of the subject -- removes any concern for points not surveyed. On the other hand, using it for points that are not visible from the ground is only possible if the scanner is mounted on some form of platform to raise its vantage point; this can be done but is not easy.
Fifth, the scanner provides data for complex shapes that is far superior to what can be obtained with the total station. This is something to which this report has not addressed itself, but it will be the subject of another report in the future.
Sixth, the scanner provides levels of detail far beyond what we would try to obtain with a total station. The large, damaged orthostate in the eastern portion of the wall, for instance, could be modeled with a fidelity impossible to obtain with a total station. (In theory, a total station could be used to obtain many points for such a block, but in reality the time required for that makes it effectively impossible.) In this particular project, however, such added detail is not the aim. The concern is with the starting sizes of the blocks; photographs may be used to show current conditions.
Seventh, the calculations suggest that the problems mentioned here contribute to a level of precision that is adequate for some work but not all. Cut-stone masonry in a relatively good state of preservation may be among the most obvious subjects requiring greater precision. Less precisely shaped and preserved masonry, on the other hand, provides a good subject for 3D scanning; the competition for surveying such material would be stereo photogrammetry -- but that is a different story and beyond the aims of this experiment.
For other Newsletter articles concerning the Propylaea Project, or applications of CAD modeling in archaeology and architectural history, consult the Subject index.
Next Article: Archaeological Data Presentation Formats on the Web
Table of Contents for the Fall, 2004 issue of the CSA Newsletter (Vol. XVII, no. 2)
 Table of Contents for all CSA Newsletter issues on the Web
| Propylaea Project Home Page |
CSA Home Page |