
|
As with mathematics, computer graphics operate in two principal modes: arithmetic or geometric. One great advantage I have found in working with AutoCAD is that this drafting system offers a congenial combination of both modalities. The history of mathematics, by contrast, has been largely unimodal. For example, whereas Euclid (fl. c. 295 B.C.E.) set the course for geometric-based thought, a marked shift toward "arithmetization" did not occur until the nineteenth century. And "only in the second quarter of the twentieth century, with the development of quantum mechanics, have we seen a return in the physical sciences to a neo-Pythagorean view of number as the secret of all things" (Bulmer-Thomas, "Euclid," Dictionary of Scientific Biography, 1971, Vol. 4, p. 425). The strength of programs such as AutoCAD® resides in their ability to accommodate both arithmetic and geometric means for plotting points. After brief experimentation with each mode, I was quickly able to determine the hypothetical plan geometry for a medieval church. This brief report aims to present the methodology and problems involved in drafting the plan and discovering the design system.
In AutoCAD, the arithmetic mode is based, of course, on the standard grid. Use of a point-coordinate system dates at least to the tenth or eleventh century (Funkhouse, "A Note on a Tenth Century Graph," Osiris, Vol. I, 1936, pp. 260-62). While plotting points on a grid creates a graphic pattern which lends itself to visual analysis and interpretation, it remains essentially an arithmetic rather than geometric procedure. As a tool, AutoCAD offers architects and designers mathematical precision through the use of a point-coordinate system. That is, contrary to manual drafting, one can readily verify the coordinates of any single point, as well as the linear distance between any two points, to a precision of several decimal points. Moreover, a special feature ensures the beginning of a new line from an established position such as the end of a line or the center of a circle. (See discussion of the osnap command in Session Two of the CSA online tutorial, at http://www.csanet.org/inftech/tutorial.html.) I will return to a problem regarding precision below.
But, unless working with a total station which itself functions in terms of a point coordinate system, architectural historians and archaeologists must rely chiefly on the geometric capacities of AutoCAD. That is, in order to draw an architectural plan after an existing structure, typically one built asymmetrically, we have to rely on the system of triangulation. Making a traditional survey using a metal tape, the surveyor is obliged to measure any given point from at least two other points. When drafting a plan, the draftsman selectively and sequentially uses the measurements to draw arc segments from a minimum of two established points in order to find their intersection, which defines the new point. A high degree of concordance between arc segments drawn from three or more established points validates the location of a new point.
Ironically, the principle of triangulation is one of the oldest geometric methods for determining a third point from two other points; its origin is ultimately Euclidean (v. Propositions I.1, I.22). Evidence for application of this technique can be found within the medieval graphic record, in the portfolio of a thirteenth-century artisan from Picardy (France) by the name Villard of de Honnecourt (Paris, Bibliothčque nationale, ms. fr 19093). Villard employed two long-necked flamingoes (folio 18v) as a mnemonic device for recalling the use of intersecting circles to determine an unknown point (v. analysis in Bechmann, Villard de Honnecourt. La pensèe technique au XIIIe sičcle et sa communication, 2nd ed., Paris, Picard, 1993, p. 320, fig. 200). Of a stunning simplicity, this figure of "two flamingoes" could serve to delineate the most precise right angle and every other geometric figure can follow from this initial construct.
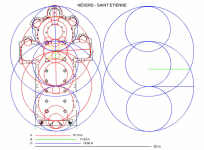
As announced in the previous Newsletter ("Using AutoCAD with Medieval Architecture," Spring, 1998, Vol. XI, no. 1), I came to CSA with the hope of quickly learning how to use AutoCAD in order to analyze the design of a Romanesque priory church for an upcoming lecture. When laying out the plan through triangulation (with dimensions derived from a standard measured survey), I chose not to use arc segments. Instead I generated circles, using a command that allows one to specify the center and radius. As work on the plan progressed, I noticed that circles drawn for plotting a new point tended to intersect other features of the plan as well. For instance, a circle reaching from the northwest crossing pier (bottom left) to the south ambulatory wall's western terminus also reaches to the north ambulatory wall's eastern pilaster. Although this specific correlation does not figure in the proposed plan design (see Fig. 1) the very process of recreating the plan with AutoCAD suggested to me a means by which medieval builders could have generated a plan on the ground, i.e., by simply using long knotted cords. I set out to test this hypothesis.
The Cluniac priory church of Saint-Etienne in Nevers provides one of the most complete statements of French Romanesque style. It was built in a short span of time (c. 1068/74 - c. 1090), and its physical fabric is homogeneous, except for isolated areas of restoration. An exception among pilgrimage-type churches, the Nevers nave offers the earliest example of a triple elevation under barrel vault (i.e., nave arcade, gallery, clerestory), which is structurally sustained through functional, interior flying buttresses. Beyond the obvious technological prowess, an almost palpable harmony of proportions suggests a planned, unified design. Extensive physical analyses provide further evidence for selecting this Upper Loire Valley church as a case study for the level of mathematical knowledge achieved in eleventh-century religious architecture (cf. Zenner, Methods and Meaning of Physical Analysis in Romanesque Architecture: A Case Study, Saint-Etienne in Nevers, Ph.D. diss., Bryn Mawr College, Ann Arbor, UMI, 1994).
A joint survey (unpublished) was undertaken in 1989-90; a partial survey of the elevation was carried out in 1991. Both were standard measured surveys using a metal tape. For the purposes of this experiment I made a digitized tracing of the Addiss plan (1992), which was based on the earlier joint survey. A tracing cannot be considered dimensionally absolute but suffices for the demonstration in question, since, although standards for modern surveys are high, medieval site layout did not necessarily achieve precision within a centimeter.
(Historians of medieval architecture now generally acknowledge a need for greater precision and objectivity in design analysis. Proposed solutions include electronic surveying techniques along with computer-aided analysis and drafting.)
The new hypothesis for the plan design stands apart from current research in that it proposes a geometric analysis which simultaneously accounts for plan length and breadth, wall thicknesses, and significant dimensions of the interior elevation.
This brief summary aims to outline the initial steps which led to the hypothetical plan geometry (Fig. 1, at left). A more complete analysis is given in Zenner, "Latin Euclid: Practical Traditions in Geometry," in Word, Image, Number: Communication in the Middle Ages, ed. S. Casciani, J.J. Contreni (in press).
The measured surveys of the Nevers church had already shown that the three principal vault heights could also be found in the plan, in terms of linear distances between several points within the axial chapel and crossing. In addition, these three dimensions (refer to scale on Fig. 1) could be related arithmetically through a common factor of 28 centimeters, which happens to be the coursing height norm in the church's ashlar walls: thus, 54 x .28 cm = 15.12 meters (sanctuary and transept vaults); 64 x .28 cm = 17.92 meters (nave vault); 70 x .28 cm = 19.60 meters (crossing dome soffit).
I therefore decided to push this correlation further by using these three key linear dimensions (i.e., 54, 64, and 70 units), or simple fractions thereof, to draw circles on the traced plan.(1) Each dimension was placed on a separate layer and color-coded (n.b. the Newsletter format does not allow for color reproduction, but broken lines have been used to replace two of the colors). With amazing rapidity, I could impose a given circle and move sequentially, by means of concentric or tangent constructions, from one circle to the next. To give just one example of concentric construction: I began with a large circle (radius = 19.60 meters), centered on the median point of the transept crossing, which enveloped the axial chapel's buttresses at the east and fell roughly mid-way in the fourth nave bay (counting from the crossing). I then drew a smaller circle (radius = 15.13 meters), from the same center (in the crossing), which described the recessed wall plane of the eastern ambulatory and fell mid-way in the third nave bay. After constructing a series of smaller tangent circles (radii defined as fractions of 15.13 meters) between the axial chapel and the third nave bay, it became apparent that the arc in the third nave bay was tangent to the center of a second large circle (radius = 19.60), whose western arc surpasses the plan of the church's nave. This arc may relate to the implantation of the former western porch, although I have yet to verify its dimensions according to the archaeological record; more importantly, the western facade defines an arc segment whose chord equals the nave vault height (17.92 meters).
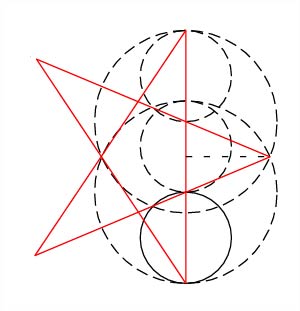
To recapitulate, all three major dimensions found expression in the major forms of the church plan. To clarify the design steps, I began to redraw the initial circles apart from the plan (Fig. 1, at right). After some experimentation, I realized that the middle circle (diameter = 70 units), the central vertical line (54 units), and the horizontal line (64 units) represented some significant geometric relationship between the three linear dimensions. I considered the possibility that this figure, like an eye, was a mnemonic device intended to encapsulate the design. Indeed, it provides the three main vault heights and the schema for the entire plan. After further mathematical analysis, I found that a certain relationship between the three dimensions approximates the golden mean. The golden mean, of course, is expressed as follows: given A = B + C, then A:B = B:C. Numerically, the golden mean (the ratio of A to B and B to C), also known as Phi, equals approximately 1.618. If we label our three linear dimensions, in ascending order, then a=15.13, b=17.92, c=19.60. These three dimensions can be related as follows: c - a : b - a = 1.602. This is a 0.01% variance from the golden mean. Further geometric confirmation for the presence of the golden mean can be found in terms of an irregular five-pointed star which can be inscribed within the eye device, with its apex at the right terminus of the horizontal line (Fig. 2). Similar irregular five-pointed stars appear three times on the same folio (18v) as the drawing of flamingoes in the aforementioned Villard manuscript. The presence of this five-pointed star within the eye device serves as confirmation of the validity of the hypothetical plan geometry, according to Renaud Beffeyte, a French carpenter-compagnon (i.e., an artisan trained in the oral tradition of the medieval cathedral builders).
Other than various difficulties presented by aging hardware, I did not find any noteworthy technical problem specific to AutoCAD, Release 13, which has not already been signaled in the Newsletter (November, 1994, Vol. VII, No. 3, pp. 11-12 (2); and "AutoCAD Release 14 - A Review," Winter 1998, Vol. X, no. 3). The online tutorial is basically straightforward, and I was able to grasp the principles of this new vocabulary within about ten hours. While I have dealt with the concept of layers, I have not yet had to address the complexities of obtaining sufficient measurements to draw a complete 3D model. This is the obvious next step in order to further test the hypothetical generation of the plan and elevation of the Nevers church.
One problem I found in using the computer screen is the ease with which real and apparent precision can be confused. I had drawn the horizontal line in the "eye" device (Fig. 1, at right) to be precisely 17.92 meters, using the point coordinate system. To my delight, it fit the space. Later in the project, I happened to use the zoom command to get a closer look and to my horror found the horizontal line ended in a void, since it did not reach the intersection of the two circles to its right. The actual measure for the horizontal line as drawn is 18.0812 meters. The question of approximation and precision became more apparent when learning to draw the plan. Occasionally, several arcs intersected in proximate vicinity. I chose to delete any outliers, reducing the choice to a minimum of three proximate arcs. The arcs produced three intersections that could be used to construct a triangle. I was then able to approximate the triangle's midpoint by drawing a median line and finding its midpoint.
The question of approximation and exactitude in medieval or modern times, and some degree of variance in measurement, would be the subject of an article in itself (cf. Frey, "Médiétés et approximations chez Vitruve," Revue archéologique, 1990/fasc. 2, pp. 285-330). But the utility of AutoCAD lies very much in its power of precision, which provides the ability to corroborate hypotheses instantly, whether operating in the arithmetic or geometric mode. Of particular interest for medieval historians, I believe, this project demonstrates that one can effectively replicate medieval techniques of laying out a site with knotted cords, through an experimental adaptation of modern tools. Ultimately, a 3D AutoCAD model would aid in determining the full implications of the geometry of the medieval design, in particular, with regard to the mathematical knowledge underlying the technological achievements of the Nevers church.
-- Marie-Thérèse Zenner
Associate Researcher, CNRS-Poitiers, France
To send comments or questions to the author, please see our email contacts page.
For other Newsletter articles concerning the use of electronic media in the humanities or issues involved in using CAD in archaeology and architectural history, consult the Subject index.
Next Article: Photorealistic Vizualizations May Be Too Good
Table of Contents for the Fall, 1998 issue of the CSA Newsletter (Vol. XI, no. 2)
 Table of
Contents for all CSA Newsletter issues on the Web
Table of
Contents for all CSA Newsletter issues on the Web
(1) These fractions are 1/2, 1/3, 1/4, 1/8, and 1/16. If one divides a cord of 54 units arithmetically, this would translate to impracticable cord lengths (27, 18, 13.5, 6.75, and 3.375 units respectively). But it is easy to divide geometrically. A cord of 54 units can be physically halved by holding together the two ends; from this one can generate new cords of a required smaller unit. The same principle applies for dividing a length into thirds. Return to text.
(2) Not available on the Web. Return to text.