
|
As reported in the last issue of the CSA Newsletter, an AutoCAD model for portions of the island of Pseira is being created. The island lies in the Gulf of Mirabello in north-eastern Crete and was inhabited sporadically from the Final Neolithic through the Byzantine period. The investigations on the island, headed by Professor Philip Betancourt and Professor Costis Davaras, are concerned with all aspects of this occupation but the CAD model is beginning with the Final Neolithic - Middle Minoan cemetery located west of the main settlement.
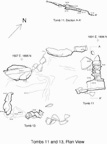
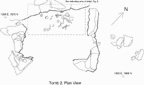
Students Kathy May, Lada Onyshkevych, and William Hafford, under the supervision of CSA Director Harrison Eiteljorg, II, have digitized 17 tomb plans and are currently inputting section drawings. Figure 1 shows the plans of two of the tombs and a section of one; Figures 2 and 3 show another tomb.
 |
 |
 |
| Fig.1 - Plan of two tombs at Pseira with a
section of one. Bedrock cracks and fissures, elevations shown. Pottery and bones omitted. |
Fig.2 - Plan of tomb from Pseira. Bedrock cracks and fissures, elevations omitted. Pottery and bones shown. |
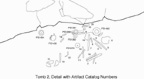
Fig. 3 - Detail of Fig. 2. Catalog numbers for pottery and bones included. |
Once completed, the CAD model will contain significant amounts of the information recorded in the field, in its proper context. This provides an invaluable analytic tool, allowing scrutinization of the macro world in a computerized micro universe.
Of course, a model cannot be better than the data put into it, but it can make the data easier to analyze and may even bring out associations which might otherwise go unnoticed. By placing separate analytical units on different layers (data segments in a CAD model), distinctions made in the field are preserved and the 'big picture' may be viewed or, by manipulating layer combinations, one aspect may be studied in a specific context.
The goal of a good model is to increase analytic capability, and the students working on this project must continually ask themselves how best to accomplish this.
Elevations could not be taken at every point in the plan, thus, a true 3-D model is not being generated. Tomb plans have been placed at their median elevation so that their relations to one another and to the general topography of the area may be seen, but individual tombs will not be three-dimensional models.
The topography of the cemetery area has been mapped (using SURFER), and it is the next task of the CAD team to import the contour map to their model.
They have begun work on placing individual finds within the tombs and coding find-density from a 5-meter-grid survey of the entire area. Figures 2 and 3 show how the tomb finds can be added to the model and printed, with or without details from the tomb and labels, to enhance understanding.
Eventual plans for the model extend to the settlement, placing individual buildings, topography, and finds for this area as well.
William B. Hafford (whafford@sas.upenn.edu)
[The drawings reproduced here were made as plot files in AutoCAD®, translated by HyJaak Pro®, and transferred to Adobe Illustrator(tm) for the addition of text and selections of appropriate line weights for the Newsletter. - ed.]
Other CSA Newsletter articles on Pseira:
Continuing Work on Pseira Model (Vol 8.1: May, 1995)
New CAD Work on Pseira Cemetery (Vol. 7.3: Nov. 1994)
For other Newsletter articles concerning the applications of CAD modelling in archaeology and architectural history, consult the Subject index.
Next Article: Scanning Pottery Profiles
Table of Contents for the February, 1995 issue of the CSA Newsletter (Vol. 7, no. 4)
 Table of Contents for all CSA Newsletter issues on the Web