
|
The Harris matrix is one of the most useful tools available to the archaeologist for analyzing the stratigraphy of a site. Recently I have experimented with a Windows program called ABC FlowCharter 4.0 (from Micrografx for about $100). While it was designed with business flowcharting needs in mind, this program also works well for diagraming the Harris matrix. It is not specifically designed to analyze stratigraphy; so it requires the user to lay out the stratigraphy him/herself. It is not a program like Seriat which will analyze the data and come up with its own stratigraphic display.
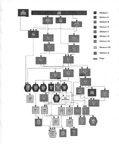 A sample Harris matrix,
drawn with the FlowCharter program. Please note that the photo reduction required for this figure may
have made some of the distinctions between and among fill patterns less clear.
A sample Harris matrix,
drawn with the FlowCharter program. Please note that the photo reduction required for this figure may
have made some of the distinctions between and among fill patterns less clear.
ABC FlowCharter allows you to select from a wide range of shapes which can be used for different kinds of loci (custom shapes can be created in paint programs); these may be of any size. The type and weight of line in each shape can be customized. The background for each shape may be filled in with a variety of fill patterns. Lines can be drawn form one shape to another to show the stratigraphic sequence. Click the line tool on one shape, drag to another shape and a line will appear which flows around intervening objects. Type and weight of line can be varied. A line which crosses another line is shown as a "bunny-hop." Lines can also be drawn anywhere on the page; e.g. an extra heavy line at the bottom of a shape can indicate a floor, or all loci of a given stratum could be separated off from other strata by lines. If a shape with connected lines is moved the lines will adjust themselves automatically to flow around intervening shapes and across lines. Each shape can display a certain amount of text (e.g., locus number and short description); text may also be added to lines or placed anywhere on the page. The full range of fonts on your system can be used. Notes can be attached to each shape if more description is required.
At 8.5" by 11" portrait size and orientation, a chart fourteen pages wide and ten pages long can be created. When printing the chart the user can request that the entire chart be printed on one page, a handy feature if your area of analysis is relatively small. The screen can be zoomed so that most of these pages can be viewed together. Charts can be linked together. For example, one master chart could contain a sequence of shapes representing the site's main strata; double-clicking on one of these stratum shapes would open a detailed chart with the analysis of that stratum. ABC FlowCharter is an OLE 2.0 server/container, letting you link to and from other applications. The linking and OLE capabilities of the program would be useful for those thinking of publishing at least some of their site reports in a computer-readable format.
Next Article: New AutoCAD Tutorial for Scholars
Table of Contents for the February, 1996 issue of the CSA Newsletter (Vol. 8, no. 4)
 Table of Contents for all CSA Newsletter issues on the Web