
|
Accurately visualizing the reconstructions of archeological sites has enormous potential for scholars as well as a more general audience. The information can be updated, modified, corrected, and checked as new data are gathered. Different versions can be built, compared, and saved for both research and aesthetic purposes. Once a building has been reconstructed in the computer, a "visitor" can literally walk through a site, looking from different viewpoints and potentially weighing one interpretation against alternatives.
My experience in creating computer visualizations of the development of the older propylon on the Athenian Acropolis over the period from the bronze age to about 450 BC is providing very useful insight into both the potential and the problems of such visualizations. In the process, I have been combining data from CSA Director Harrison Eiteljorg's AutoCAD model of the older propylon with processes available in 3D Studio, a near-state-of-the-art program for animation and architectural "walk-throughs."
Neither AutoCAD nor 3D Studio was designed specifically for archaeological work, and the challenge is to
In visualizing the older propylon, I have begun to deal with all of these.
In this project I worked entirely with data that were already in computer form -
Once done, I could bring up or hide objects at will and essentially move from one period to another, or walk through the site viewing and recording it from any viewpoint.
The first important step was to import all of the computerized site data into the 3D Studio environment and to establish a reference frame for future data. Then I methodically combined fragments of data as "objects;" stones, pillars, pieces of bedrock and so on.
Site data are inherently fragmented and not necessarily consistent. Information may be gathered by different persons, at different times, using different units of measurement or different reference points. It may represent only the visible surface or a portion thereof. It may relate to other data, a surface or object somewhat distant. Or it may contain errors or inaccuracies.
For example, even though all data were in computer files, the archaeological measurements were far more accurate than the topographic ones. Blocks of the older propylon were measured to the millimeter, but the elevation data consisted only of 2-meter contour lines. When the two kinds of data were combined in a single model, important objects could easily disappear "underground" beneath the coarse ground picture.
As these data are converted to virtual objects it becomes critical to maintain a systematic nomenclature that minimizes confusion and makes it as easy as possible to find a particular object or location. I did this in three ways:
In order to minimize confusion, I found it helpful to work on each time period as a temporary separate project, and then to merge the new objects into a master file that contains all of the objects from all of the periods, together with a single collection of light sources and cameras for viewing the result.
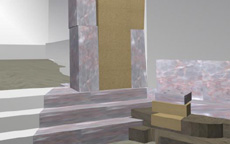
When the objects are first completed they look like gray cardboard models, but it is possible to "paint" them with almost any conceivable color and texture. In these illustrations we have added standard surfaces from those supplied with 3D Studio to the in situ materials, but we have left reconstructed portions in the gray "cardboard" mode so that it is easy to recognize the objects and locations that support this reconstruction.
 |
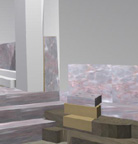 |
| Fig. 1- The last phase | Fig. 2 - Prior phase. |
 |
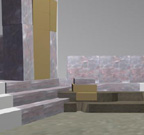 |
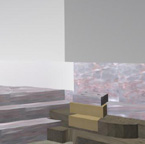
| Fig. 3 - c. 489-480 B.C. phase. | Fig. 4 - A different view of the last phase. |
One can easily see, for example, parts of the bedrock that were carved as part of the original steps - and see how the reconstruction has been extrapolated from these. In many ways this process is similar to assembling a physical reconstruction and filling the empty areas with a plain colored plaster, but I have only begun to explore this process.
It is obviously important that the viewer be able to recognize which parts of a scene are real and which have been reconstructed. So far we have approached this in a very simple fashion, using color and texture only on in situ objects. But it is possible to make a much more realistic vision by using color and texture throughout the site - and it should be possible to make variations that would both serve this purpose and also clearly differentiate between restored and in situ objects.
Similarly, it is important to be able to recognize the different materials, e.g. to differentiate between and among marble, poros, bedrock, and Acropolis limestone. I have used various colors and textures but it should be possible to develop conventions that will help the viewer still further.
So far the objects are painted with artificial colors and textures. But I expect in the near future to use digitized photos rather than artificial textures, so that in situ objects appear as close to the real objects as possible.
Although I have not reached this point, it is clear that eventually one will be able to "walk through" sites like this, picking time and location at will and comparing different interpretations. Unlike physical reconstructions at sites such as Knossus, a computer visualization can be as realistic or stylized as desired; changed and revised as new data and insight accumulate; and compared quickly with alternative interpretations. And the computer reconstructions do not require us to do anything to a site but preserve it for future generations.
[Mr. Tressel is now technically retired from the National Science Foundation, but he is very busy working on various computer graphics projects and volunteered his time on this rendering/reconstruction project for CSA. We are very grateful for his work and eager to see the next stage in the development of realistic visualizations of the older propylon - ed.]
Next Article: MiniCad 6 - a Review
Table of Contents for the Nov, 1996 issue of the CSA Newsletter (Vol. 9, no. 3)
 Table of Contents for all CSA Newsletter issues on the Web