|
|
|
|
Introduction:
On the shore of the idyllic Lake Nemi 25 km southeast of Rome is situated a complex group of ruins on the site of Santa Maria. Presently the site is being investigated by a large group of scholars and students from the Nordic countries with the kind permission of the Soprintendenza archaeologica per il Lazio. The excavation is a five-year project (1998-2002) mainly financed by the Danish Carlsberg Foundation and the Joint Committee of the Nordic Research Councils for the Humanities (NOS-H).
Lake Nemi is a small volcanic lake situated in the Alban Hills. Since antiquity this area has been a favorite summer resort for the Roman nobility and has by now almost become a suburban part of the metropolis. The Nemi lake is best known for its Sanctuary of Diana Nemorensis, famed in antiquity. The site presently being investigated by the Nordic team is situated on the southwestern shore of the lake. It features, above ground, a number of ruins such as a terrace wall, about 250 m long, a large completely preserved cistern, a huge exedra, and a number of minor structures.
The site has never been investigated scientifically. However, the architectural remains can with certainty be interpreted as belonging to one building complex to be identified as a large pleasure villa. As far as we can tell today, life in the villa was concentrated in the period from the first century B.C. to the second century A.D. Its original core belongs to the late Republican period (first century B.C.). It was rebuilt and enlarged several times during the first century A.D., and it was finally abandoned some time in the middle or second half of the second century A.D. The ancient literary sources state that C. Julius Caesar constructed a marvelous villa in Diana's sacred wood by Lake Nemi (Cicero Att. 6.1.25; Suetonius Jul. 46). We obviously hope that the villa we are presently excavating may have belonged to Caesar. However, we have no tangible proof for this (yet?).
Even though the two centuries of villa occupation provide most of the archaeological material, the site was frequented as early as the Middle Bronze Age and seemingly occupied more permanently from the Final Bronze Age or Early Iron Age. Stray finds attest to activities (mainly agricultural) in the area during the period following the abandonment of the villa, and the site was never built on again.
Planning the Excavation:
When planning the excavation, we had to take the following natural conditions into consideration: the huge extent of the site (probably about 50,000 square meters), the scattered ruins, and the low visibility in the terrain, which was completely overgrown with ferns and brambles to a height of 2-3 m. Moreover, we had to take into account the comparatively short period of excavation, five years in total with six effective weeks of excavation each year performed by 30-40 students and volunteers and 4-6 hired workers. It was also an expressed wish of the excavation's board of directors that we aim at on-site registration of all finds and complete (and fast) accessibility for all those involved in the publication process to the documentation of the excavation. The goal was to shorten considerably the time consumed by the publication phases. As a means of accomplishing our goals, we decided beforehand to employ computers extensively for documentation and analysis. Considerable amounts of time and money are thus invested during the period of the actual fieldwork and between the campaigns instead of postponing this investment to the publication phase. However, we believe that, in the end, this choice will not only save time and money but will also increase the efficiency and quality of the final result. The self-conscious application of a data model to organize the documentation of the site enables us to handle unlimited amounts of raw data and (as far as possible) to differentiate between documentation on the one hand, and interpretation on the other. This will be, we believe, a significant contribution to improving the scientific quality and the potential outcome of the effort. For all of the above-mentioned reasons, computer technology is used in the following areas:
Digital mapping in 2D and 3D to document, analyze, and present the relationships between finds and structures graphically:
Maps are produced in 2D and 3D. These maps will ultimately key together the overall documentation of the excavation (finds, find contexts, structures). Some aspects of the digital mapping will be discussed below.
Documentation of the trenches:
All trenches are laid out with the total station as a fast and accurate way of doing so. The trenches are excavated in small units, called soil blocks (SB). They follow the archaeological strata whenever identified, but represent smaller mechanically dug subsections of these strata. The choice of digging at this high level of resolution certainly generates more administrative work. But the extra time spent is outweighed by the security and analytic perspectives it also provides. The archaeological description of the soil blocks, including their corner coordinates, are entered consecutively into a database by members of the trench team. Strata and architectural elements are recorded manually in plan and section drawings. We do not use the total station for the registration in the trenches of finds and soil blocks, because too many total stations would then be needed. Instead, the students are still using a leveling instrument and tape to register special finds and the context of the finds. All field diaries are entered into the computer consecutively.
Documentation of the finds:
All finds from one SB are sorted out by type. As the finds are mainly pottery and building material, the pottery is sorted out into more specific ware types, e.g. impasto, sigillata, plain ware, etc. The sherds in each group are then counted and weighed and the information entered into a database. All diagnostic pieces are analyzed individually, and the information from this analysis is entered into another database with links to scanned profile drawings and digital photos. All the above information is linked to the documentation of their context, the SB.
Photography:
The trenches and structures are documented with photographs (mainly film but also digital), and all diagnostic finds are recorded with digital photos - with supplementary documentation of key pieces on film. Digital photography is currently being used alone as a fairly low-cost way of recording, first and foremost, finds for working purposes. When the finds are eventually published, the comparatively few objects to be illustrated will be photographed again in a studio under optimal conditions. A database is constructed in order to organize the data on the photographs. This is updated currently by the photographer.
Publication:
It has not yet been decided how we are going to publish the final results. The rapid ongoing development of computer technology obliges us to leave that question open. But certainly a printed book will not have room for all the documentation. A printed version combined with supplementary documentation either on CD-ROMs or available via the net is a possibility.
The first steps:
Before this field project materialized, none of us had any experience in either digital mapping or in larger relational databases; so our first step was to find out which possibilities were at hand and what others were doing. No comparable experience was available from Nordic projects in the Mediterranean world. We therefore turned to our Danish colleagues in prehistoric archaeology, where there is a widespread use of GIS and where the software MapInfo® now seems to be more or less standard. However, a Danish prehistoric site has very little in common with a Roman villa site in Italy, the latter being characterized by its 10 m. high walls, deep foundations trenches, high fill layers etc. So our idea of a powerful tool for analyzing the excavation data couldn't be fulfilled by the type of setup proposed by our colleagues. It was, though, of great help to us to speak with colleagues experienced in digital registration of excavations. Though we chose different software, MS-Access® for our databases and AutoCAD® for the digital mapping, we did not "burn any bridges," as files from both programs are compatible with MapInfo.
We were advised to employ a professional surveyor for the initial set-up of the fixed-point net and for instruction in the use of the total station and the associated software. We therefore engaged a surveyor from the Danish National Museum for the first two weeks in the first campaign in 1998. This has saved us from many possible failures, and we have had no major problems with implementing either the hardware or the software for the digital mapping in the survey/architect group.
Digital mapping:
The fixed-point net, which was laid out in the first campaign, covers almost the entire expected area of the villa. It is, therefore, possible to operate with only one coordinate system, and all measurements are thus immediately comparable without any time-consuming transformations between different coordinate systems. In February, 1999, this local coordinate system (which we will keep as our 'working' coordinate system throughout the entire period of excavation with the exception of the elevations) was fixed with GPS to the WGS-84 and UTM zone 33 coordinate systems so that we now can use the absolute elevation and true north for our entire registration. The local coordinate system and the fixed points verified with GPS have an imprecision of less than 2 cm. We will thus be able locate the exact positions of the structures and trenches in the future, even if the actual fixed points have been lost.
A digital 2D map of the entire area is currently being executed. This map shows all ancient structures, significant modern structures, and the trenches. During the period of excavation the map is updated daily. Due to its high accuracy, it has proven to be a very useful tool, e.g., for analyzing the possible relationship between walls and structures over large distances, relationships that cannot be verified optically on the ground due to large distances between the structures, low visibility on the ground, and structures being partly under soil.
More detailed drawings, e.g. of marble floors or of the tops of the walls, are made by hand. The drawings are fixed into the coordinate system in one of two ways. One, the outline of what is to be drawn is first measured with the total station. A scaled print in of this outline serves as the point of departure for the drawing, which can then be made more or less freehand within the outline. This is an economical way of producing a drawing with an acceptable result whenever high accuracy isn't required. Two, the standard procedure using a level string as the baseline for the drawing can be employed. The string is surveyed with the total station and the drawing is thus fixed within the overall coordinate system. After scanning the drawings and vectorizing them with CAD Overlay®, a semi-automatic vectorizing program, the hand drawings are subsequently added to the AutoCAD plan of the site. In this way, all of the plans are united in one drawing, easy to reproduce and to distribute, for example with VoloViewer®, a freeware DWG-file viewer from AutoDesk. The result is also, in most cases, acceptable for printing and can therefore, to quite a large extent, replace ink drawings. This implies that a good many of the plans can be ready for printing soon after the trenches have been excavated.
As a part of the 2D site map, contour curves have been generated from our own measurements of terrain points. The curves document the modern terrain and indirectly the Roman walls embedded in the site's modern terraces constructed for agricultural purposes. By now the measured area covers about fifty percent of the entire villa area, and work has been carried out whenever the ground visibility allowed this. There is an overall difference in elevation of up to 50 m. over a horizontal distance of less than 130 m., due to the sloping terrain and the many terraces. Therefore, we have been measuring in a grid with a distance between the points of only 2 m. and of 1 m. in the break lines, for instance, the top and bottom line of a terrace. This has enabled us to generate 0.5 meter contour lines which illustrate the terrain well, including the terraces. By now a total of about 7,000 terrain points has been measured. The total cover, however, awaits further clearing of obstructing vegetation.
The points measured to generate the contour lines will also be used to create a 3D model of the terrain. However, this will await the conclusion of the overall measuring.
3D models based on total station measurements:
The villa's well-preserved cistern and a monumental exedra in the southwestern end of the complex have already been modeled.
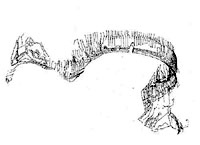
The exedra is a huge structure built in opus mixtum probably in the 1st century A.D. (Fig. 1). It consists of an open horseshoe-shaped room in two stories and two wings, also in two stories. The building is constructed directly against the natural and very friable pozzolana rock. The overall width is 48 m. including the wings, with a visible height of 10.5 m. The horseshoe-shaped room in itself has a diameter of 21 m. and a depth of 17.5 m. The exedra is partly covered with soil, and its preservation is precarious. In the 1999 campaign, it was therefore decided to record the structure as preserved without doing any excavation as a means of preserving at least a graphic image of this impressive structure.
Our idea was basically to create a 3D model which could document all key measurements, the varying types of surfaces (tile, reticulate, plaster etc.), and the complex form of the ruin. Before starting the actual measuring for the 3D model of the exedra, we discussed the number of data points to be surveyed, what we called the resolution of the model. Of course we wanted the model to be as accurate and detailed as possible, but under the circumstances we could not spend years measuring it. This is the largest structure of the site and the resolution we would settle for here should also be applicable to all other structures in order to obtain a uniform documentation level: a short stretch of a wall should, accordingly, not be documented in greater detail than a larger one, just because of its more handy size.
From the first year's campaign we knew that we could measure about 500 points per day, including time for downloading, coffee breaks, etc. By conducting some experiments we had also found out that it was better to measure in sections, surveying points along vertical lines and always including the points where surface types change, instead of tracking the transition lines between the various types of surfaces. In this way we obtained a uniform coverage of the surface of the entire structure, and at the same time well-organized data.
The decision to work in sections and the time required for surveying provided the parameters for establishing the resolusion of the model, and we were then able to calculate the expected time required for measuring. Every section would on average consist of about 15 points vertically, one in each break line. Since the exedra wall is about 100 meters long, a section for every half meter in plan would require about 3000 points equaling 6 days of measuring, a time investment and a resolution we found acceptable.
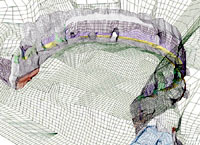
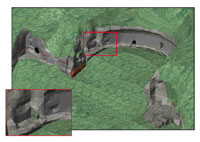
The survey package employed (SDRMap®) produces a DXF file with 2D and 3D lines and points. When measured, the 2D lines and points are coded with layer designations. This facility is not available for the 3D lines and points. Therefore, all 3D lines are transferred into one layer, and all 3D points into another when imported in AutoCAD. After downloading the lines and points measured (Fig. 2), the various types of surfaces and their preservation were drawn in different layers in AutoCAD using the AI_MESH command which draws a mesh based on four points (Fig. 3). We learned that it was very important to add the surfaces as soon as possible, preferably the same day as the sections were measured, because this saved us from making hand-drawn sketches of the measurements too, which obviously speeds up the process.
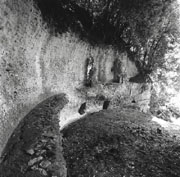
Creating the computer model took about one to one-and-a-half weeks for two persons to measure, and a further one to one-and-a-half weeks for one person to add surfaces to the model. During the same campaign two architecture students spent 6 weeks making a "traditional" manual measurement of the same structure and recorded a number of architectural details. The two approaches show the same surfaces and forms but in very different manners and with different purposes and audiences in mind. The AutoCAD rendering facilities create a semirealistic image of the complex structure, which can be understood by non-specialists (Fig. 4), whereas the traditional drawings made with projections are mainly aimed at a specialist audience (Fig. 5).
Fig 5 - Detail from architecture students' drawing of the exedra showing roughly the area included in the inset in Fig. 4. Note that the size of the original made it impossible to produce a useful image of the entire drawing at a size possible to use on the Web; so only a detail is shown. The larger drawing linked to this view is not a larger version of the same drawing but a view showing a larger area. Even that large image shows less then ten percent of the paper drawing.
Further perspectives:
In a future article we will describe the structure of the databases. We will also discuss the method of computing the volume of the convex soil blocks based on the 3D coordinates of their vertices (corners). The result of this analysis enables us to calculate the densities of varying find groups and thus to compare quantitative figures for the archaeological layers. In the last article we will present some of the analyses based on database queries presented graphically in AutoCAD with 2D and 3D digital mapping. The aim of these experiments is to create a forceful tool for the analysis of an endless amount of archaeological data based on non-interpreted evidence presented in a 3D environment, a kind of 3D GIS. This will enable us to ask questions about the excavated material that would be impossible without computer technology.
Equipment (1999):
Hardware:
Two total stations, Sokkia Set 3® with SDR 33 data stack
2 Pentium®/233 MHz computers for digital photos and AutoCAD (in 2000 supplemented with 1 Pentium III/500 MHz) and 4 second-hand 486/66 MHz for filing into databases and for wordprocessing
2 ZIP® drives (250 Mb)
CD-ROM R/W
Digital camera, Nikon Coolpix 950®
Mustek 1200 A3 Pro® scanner for plans
AGFA DuoScan® for scanning of slides
HP Deskjet® 1100 C A3 color printer
HP LaserJet® 4M
Software:
MS Office 97®, including Access
AutoCAD R14 and CAD Overlay
SDRMap, downloading program for the total stations
Surfer®, terrain modelling program
Thanks to:
The Soprintendenza archeologica per il Lazio, the directors of the Nordic Institutes in Rome, Aarhus University, surveyor Klaus Støttrup Jensen (Danish National Museum), Karsten Mikkelsen (Aarhus School of Architecture), Thomas Højstrand Jensen (Rambøll), Jørgen Rubæk Hansen (Rambøll), Lars Nørbach (Moesgaard Museum), Rune B. Lyngsøe (Department of Computer Science, Aarhus University), and to the Carlsberg Foundation, the Joint Committee of the Nordic Research Councils for the Humanities (NOS-H), and the Fondazione famiglia Rausing.
Further information:
www.dkinst-rom.dk/nemi/ contains links to previous information on the project in English, Italian and Danish.
Authors:
Søren Fredslund Andersen, responsible for measuring, computers and
computing, University of Aarhus
Pia Guldager Bilde, field director, University of Aarhus,
To send comments or questions to either author, please see our email contacts page.
For other Newsletter articles concerning applications of CAD modeling or GIS in archaeology and architectural history; Electronic Publishing; or the use of electronic media in the humanities; consult the Subject index.
Next Article: CSA Propylaea Project Taking Shape
Table of Contents for the Spring, 2000 issue of the CSA Newsletter (Vol. XII, no. 3)
 Table of Contents for all CSA Newsletter issues on the Web