
 |
One of the first jobs of the CSA Propylaea Project is the scanning of drawings from the Propylaea records. The drawings are to be scanned for archival preservation; so an experiment was undertaken at the CSA offices to determine the level of resolution required for archival use. A photocopy of one drawing was scanned at various resolutions from 150 dots per inch to 600 dots per inch. Since the original was a photocopy rather than one of the originals, all scans were done as black-and-white scans, not gray-scale.
Some details about scanning and displaying images follow here for those not familiar with the issues of scanning resolution and image display resolution that come into play. You may want to skip the following blue text and go on to the discussion about the Propylaea drawings.
Scanning a drawing at a specific resolution, say 300 dots per inch (d.p.i.), means that the scanner examines each 1/300-inch x 1/300-inch square of the original and decides on the color or level of gray for that particular portion of the whole. The resulting digital file contains a specific level of gray or a specific color for each point on the original, with the size of that point on the original being determined by the scanning resolution. (As in this case, the scanner may also be directed to decide only whether a given point is to be considered black or white, with neither color not an intermediate gray value assigned.)
When a user with a graphics program examines the resulting file, the image will normally be fitted to the screen, and the size of the whole image on screen is unrelated to the original. Any image, however, has a maximum enlargement (before there is distortion of any kind); that maximum enlargement occurs when every scanned point is represented by a single photosensitive spot on the screen (pixel). Were the image to be made larger still, for example, doubled in width, the computer would have to create a value for every alternate pixel; the file would contain no data for those pixels.
Since most monitors have about 72 pixels per inch, the size of a maximum resolution screen image made from a scan will generally be much larger than the original drawing. A drawing scanned at 150 d.p.i., for instance, would be more than twice as wide on a computer as on paper, since the 150 points scanned in each inch would need more than two inches of screen pixels for display (two inches at 72 pixels per inch yields 144 pixels).
The size of an on-screen image at maximum enlargement is not only dependent on the size of the original but also on the resolution at which it was scanned. Consider table 1 here:
| Table 1: Pixels in a single row of a screen image for drawings of different widths and scanning resolutions | ||||
|---|---|---|---|---|
| Original Image width | Scanning resolution |
Number of pixels required to show all scanned points in one row |
Screen width required for image at 72 d.p.i. | |
| A | 5 in. | 150 d.p.i. | 750 | 10.4 in. |
| B | 5 in. | 300 d.p.i. | 1500 | 20.8 in. |
| C | 5 in. | 600 d.p.i. | 3000 | 41.7 in. |
| D | 10 in. | 150 d.p.i. | 1500 | 20.8 in. |
| E | 10 in. | 300 d.p.i. | 3000 | 41.7 in. |
| F | 10 in. | 600 d.p.i. | 6000 | 83.3 in. |
Using a browser to view an image is different from using a graphics program. Browsers cannot re-size images. That is, browsers can only show images at maximum resolution -- one pixel for each scanned point in the case of scanned images. Therefore, the examples in Table 1 require screens of various sizes for the entire image to be displayedd. Images B and D would be the same size on screen, but image F would be twice as wide (four times as large in area) as image E, despite that fact that the both scans were made from a ten-inch wide original. The on-screen size of an image is therefore dependent on the width of the image in pixels, not its original width.
A browser can show an image at a smaller physical size (using fewer pixels) only if the image has been reduced in a graphics program so that fewer pixels are specified or if the html code specifies a window smaller than would be required for the entire image so that the browser reduces the image size. (The italicized text was added on March 7, 2001, to correct the statement. The error in the original was noted by reader Dr. Nat W. Alcock of the Univeristy of Warwick.) Reducing images in either (replacing that to reflect change in prior sentance, March 7, 2001) way is commonly done, but the results are often problematic for line art, since simple, mathematical reductions of pixels almost always yield unsatisfactory results.
Here are four versions of the experimental scans of a Propylaea drawing, one at 150, one at 200, one at 300 and one at 600 d.p.i. (figures 1 through 4). Each is a detail of the same portion of the scan, a portion with some numbers on the drawing for comparison, and each is presented at full scale, so the sizes are very different, from the diminutive 150 d.p.i. image to the enormous 600 d.p.i. version. The CSA experiment concluded with a decision to scan drawings at 300 d.p.i. It seems that the 600 d.p.i. scan did not add useful information, while the lower-resolution scans did not preserve sufficient detail.
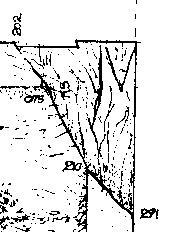
Fig. 1 -- Detail of drawing |
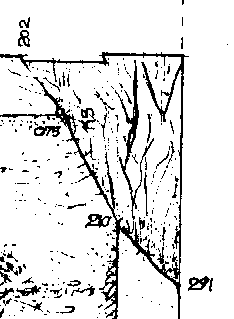
Fig. 2 -- Detail of drawing |
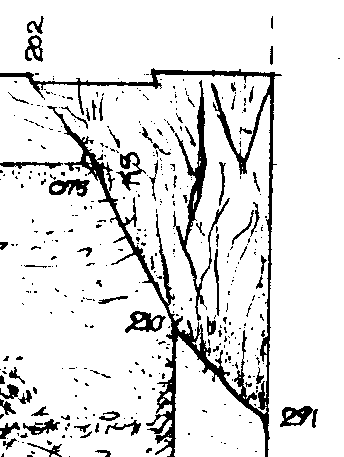
Fig. 3 -- Detail of drawing |
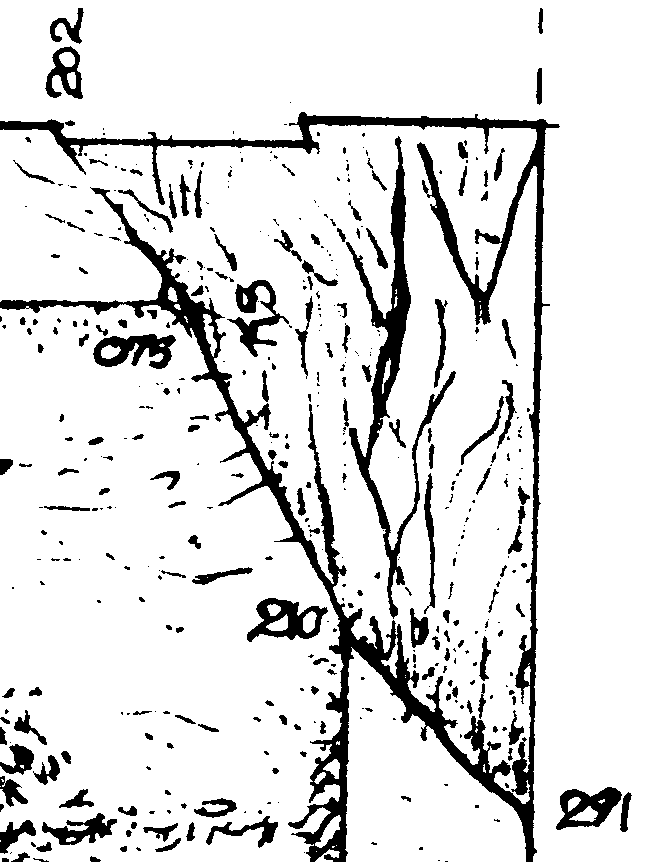
Fig. 4 -- Detail of drawing scanned at 600 dots per inch.
Work with original drawings is now being carried out, and the additional question of black-and-white versus gray-scale scanning will be settled in the near future. Meanwhile, there is another issue of importance. Can the drawings be displayed on the Web usefully, since they will have to be reduced significantly to fit on a computer monitor, and, as with any line art, the reduction process is unsatisfactory?
The question of size may seem trivial, but it is not. When a raster image of line art is reduced, the result is not simply a smaller version of the original. (Note: See Raster and Vector Images -- An Important Difference, by S. C. Jones from vol. X., no. 1 [Spring, 1997], for a discussion of the nature of raster images and a comparison to vector images. Vectorizing these drawings might seem a reasonable approach to solving this problem here, but drawings with this kind of artistic quality are all but impossible to vectorize.) Reducing such a drawing is equivalent to scanning at lower resolution; details may be simply omitted, not just made smaller. In fact, experiments carried out at CSA indicate that a drawing scanned at 300 d.p.i. and then reduced to half its original resolution is, not surprisingly, effectively equivalent to a drawing scanned at 150 d.p.i.
This problem of size is quite apparent when these scanned drawings are to be displayed on the Web. If a drawing is scanned at 300 d.p.i. and then displayed at 72 d.p.i. (typical monitor size), the result is an image more than four times as wide and as long as the original. Thus, an 8.5 x 11 inch drawing, scanned at 300 d.p.i. and displayed on a computer monitor at 72 d.p.i., will be more than 34 inches wide and 44 inches high. Although a browser can deal with such an image, the user must scroll up-and-down and side-to-side to see all the image, and at no time is there enough of the image on display to make the whole understandable. On the other hand, lower-resolution images, because of the problems of dealing with line art, are not desirable either. Figure 5 shows a portion of the drawing from which the details in figures 1 through 4 were taken, but in this case the drawing was scanned at 72 d.p.i. Figure 6 shows the same portion of the drawing, but in this case the scan was at 300 d.p.i., and the image was reduced to 75 d.p.i. (75, not 72, because the reduction by a simple fraction should yield slightly better results).
During some experimentation, the 300 d.p.i. image was reduced on-screen to twenty-five percent of its full size, the size of the image in figure 6. That is, the screen was displaying (at 72 d.p.i.) a one-fourth size version of the 300 d.p.i. image. Oddly and inexplicably, that version of the image was much better than the other two, and it is shown here as Figure 7. (The screen image was captured and made into a new drawing, but the reason for the difference in quality is simply the nature of the display algorithm as compared to the file alteration algorithm.)
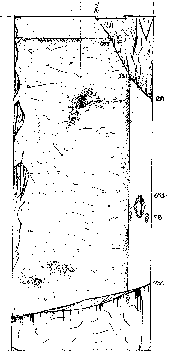
Fig. 5 -- Full drawing |
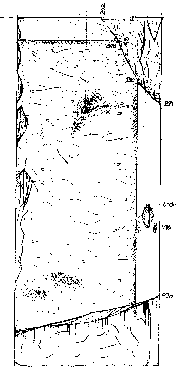
Fig. 6 -- Full drawing |
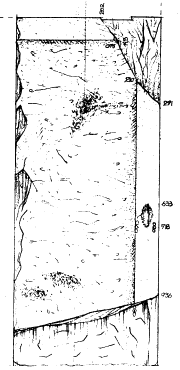
Fig. 7 -- Full drawing |
Figure 8 is the full image, at 300 d.p.i. Readers should only select that image for viewing if they are truly interested to see the results. It is very large and unwieldy. Please select this link to Figure 8 to see the 300 d.p.i. image at full size.
The results of the first two ways of producing a life-sized image are more or less indistinguishable, and neither is a good representation of the drawing. Indeed, neither is good enough even to give an impression of the actual drawing, and the text, for instance, cannot be deciphered. The third version, however, is a much better representation of the drawing, though the text is still indecipherable. So what choices are available for providing access to scanned drawings?
1. The whole drawing, at 300 d.p.i., could be provided as a Web image as in Figure 8.
2. A selected detail could be shown on the Web site, with the whole drawing available for download.
3. The third version of the reduced-resolution image could be provided as a Web image, with the higher-resolution drawing available for downloading or as a Web image.
4. Drawings of large portions of the building, with individual blocks labeled, could be used to lead to individual drawings for downloading or Web pages with the higher-resolution drawing.
After the initial experiments, it seemed that option 3 would not prove useful. However, the surprise finding -- that a smaller screen version of the 300 d.p.i. image is much better than a reduced file -- suggests that such a course may be reasonable. Readers' opinions will be gratefully received.
For other Newsletter articles concerning The Propylaea Project, electronic publishing, or the use of electronic media in the humanities, consult the Subject index.
Next Article: A Subtle CAD Problem -- The Surface Normal
Table of Contents for the Winter, 2001 issue of the CSA Newsletter (Vol. XIII, no. 3)
 Table of Contents for all CSA Newsletter issues on the Web