
|
Lee Ullmann and Yuri Gorokhovich
It is widely accepted that the cultures archaeologists study are not static, yet the methods by which archaeologists go about analyzing these cultures can be. The adoption of new technology is not often received with open arms by many in the field, be it for financial reasons or inhibition to learn a new technological tool. With this in mind, in the following article we will present, and provide for some a tutorial to, a new technological innovation, Google Earth. Google Earth in its simplest form is a 3-dimensional map of the world that allows people to search for maps of specific areas. The program is both free and easy to navigate and can offer an array of new facets to the research and presentations of archaeologists, ancient historians, anthropologists, art historians, and educators in general. Simultaneously, we hope to offer some possible applications and some insight into the connections between Google Earth and GIS (Geographic Information Systems). GIS software has been known and used by archaeologists for some time now, yet Google Earth enables the user to integrate maps created on GIS with the Google Earth interface.
Google Earth was launched in June of 2005. Google Earth was created by the Google corporation and they explained on their website:
And speaking of the world at large, our Keyhole acquisition last fall led us to create Google Earth, which was unveiled in late June. This technology enables users to fly through space, zooming into specific locations they choose, and seeing the real world in sharp focus. It turns out that when we talk about "the world's information," we mean geography too. (http://www.google.com/intl/en/corporate/history.html#2005, last accessed February 6, 2006)
The basic program itself can be downloaded for free at http://earth.google.com. There are two more advanced versions, Google Earth Plus and Google Earth Pro (neither available for the MAC), that can be purchased for $20 and $400 respectively. The main advantage to Google Earth Plus is that you can import data from your GPS (Global Positioning System) handheld device such as tracks and waypoints. Google Earth Pro is significantly more expensive and offers such features as the fastest Google Earth performance, the ability to annotate maps with lines and polygons, and the ability to export high quality images. Currently, Google Earth is offering a seven day free trial so that users can try out the software before they decide to purchase it.
The website offers many helpful answers to the myriad of questions that can arise when downloading new software, such as computer requirements, compatibility, security issues, etc. It also provides a very nice feature called Product Tour, which takes users through some of the basic functions of the program. One of the more helpful explanations for archaeologists is the Measure Distance tool; the explanation can be found at the bottom of the Product Tour page, http://earth.google.com/tour/. The measurement taken is "as the crow flies," however it can be very useful when trying to measure the distance between different sites and/or the location of a site to a specific natural resource.
Before moving on to the many ways Google Earth can be incorporated into archaeological studies, it would be good to review some of the general aspects of the program, most of which are discussed on http://earth.google.com. All of the images that make up Google Earth come from satellite and/or aerial images shot over the last three years. Images of the different regions of the world are pieced together like a puzzle to make up a pseudo-continuous image of the entire face of the globe, almost like a mosaic. Unfortunately, the resolution of the imagery is not consistent all over the world. For the most part the images are in medium resolution, with some major cities around the world available in high-resolution (http://earth.google.com/faq.html, last accessed February 6, 2006). The high-resolution imagery allows one to see many details, even details on individual buildings. One excellent example of the high- resolution imagery comes from Athens, Greece; one can actually zoom in on the Acropolis map and get a very good sense of the layout and the locations of the different buildings and even individual columns of those buildings.
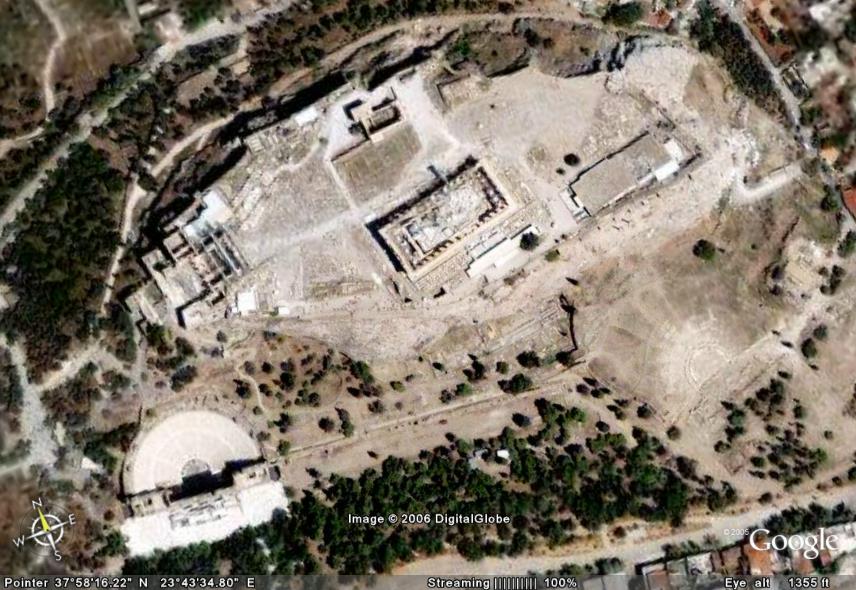
Fig. 1 - Zoomed-in image of the Acropolis, Athens -- credit to Google
For urban areas in the United States, such as New York City, the high resolution images allow one to make out words that have been painted onto the city streets by the Department of Transportation (See Fig. 2). However, this is not the case for all cities and locales, and it can be somewhat frustrating when you are trying to trace a river and only some of the images along the river are in high resolution while others are of a much poorer quality. Because the images are not in real time, some of the images may also be out of date in areas where change is occurring rapidly.
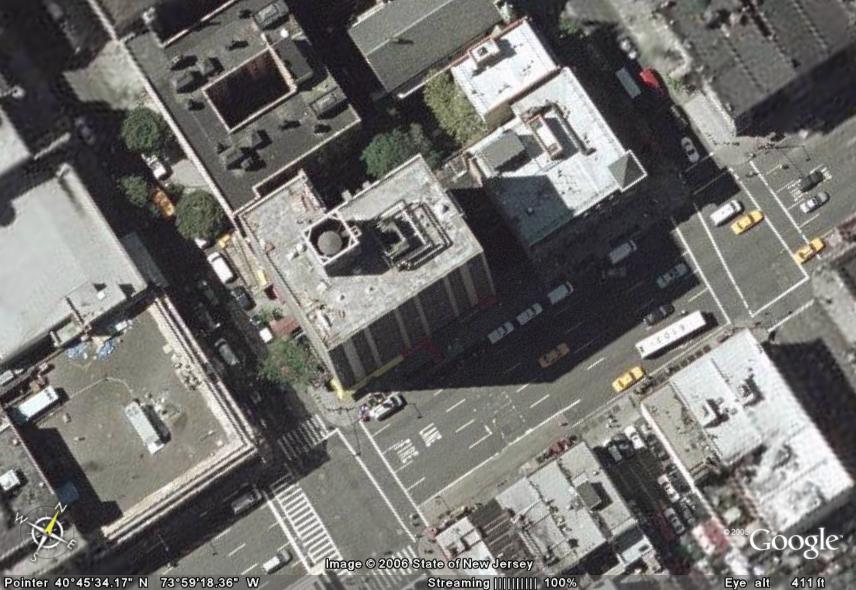
Fig. 2 - High resolution image of a street in Manhattan, New York -- credit to Google
Although one can find sites by using landmarks, natural formations, and relationships or distances to known urban centers, it is infinitely easier to find a site by knowing its Northing and Easting or latitude and longitude coordinates. If you know the latitude and longitude, you can easily use the cursor (in the shape of a hand) to move across the screen until the points for which you are searching are indicated on the bottom of the screen. Double-clicking then zooms in on the map at that given location. The coordinates are given in degrees, minutes, and seconds; to change the measurement to decimal degrees, select the Tools option on the top right of the screen and then select the Options category, and the Rendering group. There the change from degrees, minutes, seconds to decimal degrees can be made. People who have standard handheld GPS units might find that the readings they took in the field do not match up with the location of their site on Google Earth. This is a result of the inaccuracy of most GPS units that were purchased for under approximately two-thousand dollars. If you are interested to see the amount of error that is generated by being off one minute or one second please go to the website of the Texas Commission on Environmental Quality at: http://www.tceq.state.tx.us/gis/geocoord.html where they offer helpful charts on the measurements of degrees longitude and latitude based on where you are in the world.
Once you have located your site, you should add a pushpin to that location and label it. From then on every time you start up Google Earth your pushpin will be there with the name you gave the point. A nice visual effect occurs when you find a particular place when you are in the zoomed out mode and double click on that point; the program automatically zooms in on that point in a rather dramatic manner. Please remember that, although Google Earth will work without an internet connection, it will only show detail on areas for those images which are in your cache, that is, Google Earth is working but only at a limited capacity and you will not be able to fully zoom into and see detailed images of most places.
What makes the program helpful for archaeologists, especially when using Power Point, is that you can find a certain site and/or several sites, mark them on the map, and then save and export the map as an image file. This can be done by simply going to the File option on the top right and then saving the image. Images can only be saved as JPEGs, but this should not present a problem for most people. Google Earth allows you to give your audience both a feel for the distances between two sites and the terrain that exists in between these places. One can manipulate the map in such a manner that the viewer gets the sense that your site is the focal point of the world.
Another nice feature that Google Earth offers is the different layers of information that can be added to the map. Names of these layers are found on the bottom left of the screen and can be turned on or off by checking the appropriate box. Once again most of the layers are only applicable to the United States. However, we imagine that, as the world becomes more technologically advanced, these features will work for all or most of the world. Unfortunately, a problem may arise when different layers are added; they may not overlap correctly. For example if a user selects the Water layer and then zooms in on a particular part of a river, the outlined area for the river might not coincide with the actual river in the aerial image (See Fig. 3). This is a result of the different projections and scales that are used for the layer data and for the images that make up the map. For a more detailed discussion of this issue please see an article from the CSA Newsletter Vol. XV, No.3 "Database, CAD, and GIS Training Needs," which outlines the problem for GIS. Because it can be quite odd to show an audience an image with the same river in two different areas, the feature should not be used when items on the map and data layer do not coincide, which is rather common.
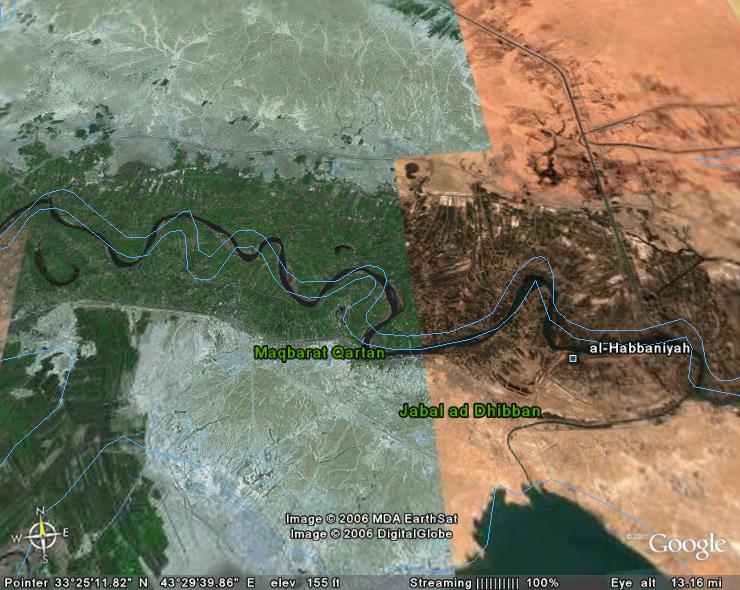
Fig. 3 - Example of water layer not aligning correctly with the actual body of water. - credit to Google
While Google Earth cannot serve as a substitute for conventional GIS software such as ArcGIS,® Idrisi,® MapInfo,® Intergraph,® SmallWorld,,® Manifold,® or GRASS,® it does offer multiple capabilities for data visualization and display. One reason why Google Earth cannot act as a substitute is that the program does not have tools that allow the user to perform vector or raster analyses, such as buffer, intersect, raster calculator, focal or global interpolation methods, etc. However, its capability for visualizing complex and large datasets over the Internet is quite impressive. For example, when using a fast Internet connection (T1 or T3 line), the average 160x160km Landsat image with a size of 120-160 Megabytes takes several minutes to both download and view in ArcGIS, using a Pentium IV processor on a robust Dell workstation. In Google Earth the same process of viewing seamless Landsat landcover imagery, on a similar computer, takes a mere seconds and makes it possible to view terrain characteristics anywhere in the world with a good resolution of 25-30 meters.
One of the attractive features in Google Earth is its ability to allow the user to overlay custom imagery on top of the currently viewed terrain area. In standard GIS software this procedure is usually achieved by the process of georeferencing, the process of associating data points with specific locations on the earth's surface, and image registration, the process of establishing point-by-point correspondence between two images of a scene. However, Google Earth provides simple tools, like "corner markers" in the area of a custom image that allow the user to drag and stretch an image (this process is also known as rubbersheeting) on top of the terrain; then the user can match specific recognizable terrain features on both the custom image and the Google Earth terrain. This procedure eventually achieves similar results to those that usually take some time to achieve by an experienced GIS operator.
This process of "rubbersheeting" involves the following sequence of steps:
1. Select in Google Earth an area that approximately matches the area of your custom image.
2. Click Add on the menu/tool bar of Google Earth, then à Add Image Overlay. You will see then the following menu:
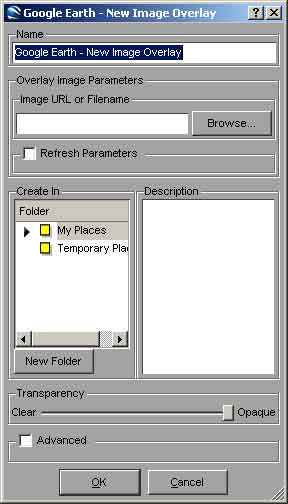
Fig. 4 - New image overlay menu from Windows version of Google Earth.
3. Take note of the Transparency bar. By moving it to the left you will be able to see the features below your custom image better; moving it to the right will darken the custom image and block more of the underlying one. If the custom image is more transparent, you can see the green "corner marks" and the green "central mark" that you will use in the rubbersheeting process better.
4. Notice also the "Create In" window. You can choose either "My Places" or "Temporary Places" for storing your image overlay. In this case we will use "My Places".
5. Click the Browse button and point it to your image; it must be an image file in one of the most common formats (i.e. JPG, BMB, GIF, TIFF, JPEG, PNG, TGA).
6. After you select the image you will also see in the Google Earth window four green "corner marks" and one green "central mark", as in figure below:
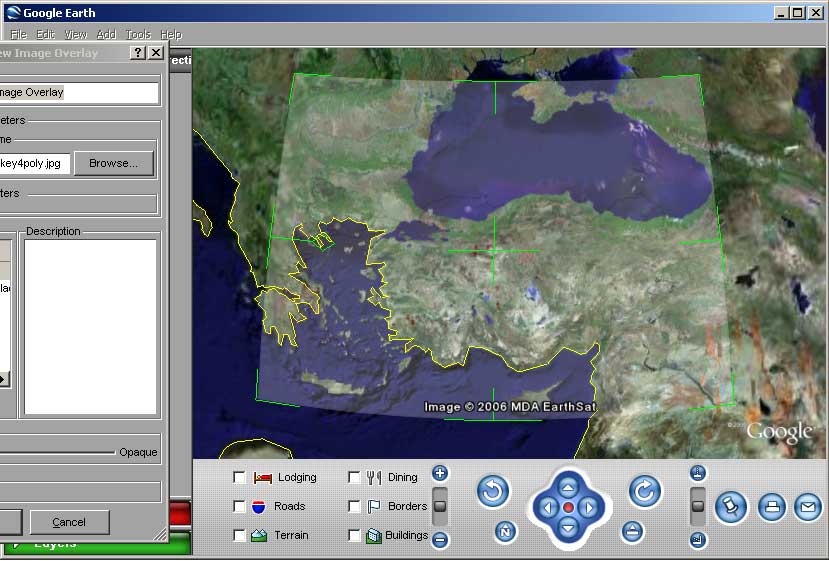
Fig. 5 - Image overlay after adjustment - credit to Google
7. By adjusting the Transparency level and moving the marks with your mouse (left button should be depressed) you can match certain features on your custom map and features in Google Earth window to make a spatial fit.
8. After you are satisfied with your results, click the OK button on the menu and you will see "new Image Overlay" in My Places.
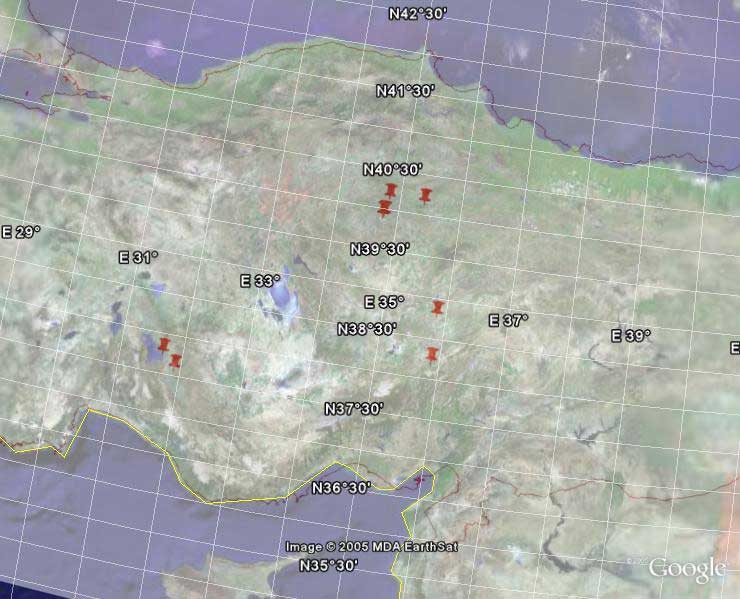
Fig. 6 - Image overlay. The image with the points was originally exported from ArcGIS as a JPEG image and then imported into Google Earth. - credit to Google
In this case the advantage is that the user can utilize the coordinate system provided by Google Earth and also can turn on or off various layers of information associated with the Google Earth module. This technique can also be used to overlay site plans on top of the actual terrain of an archaeological site; this process permits the user to see the topography of the site with the grid plan on top of it. One can use the transparency sliding-bar, which is located beneath "Places", to adjust the opaqueness of the image or plan overlaid.
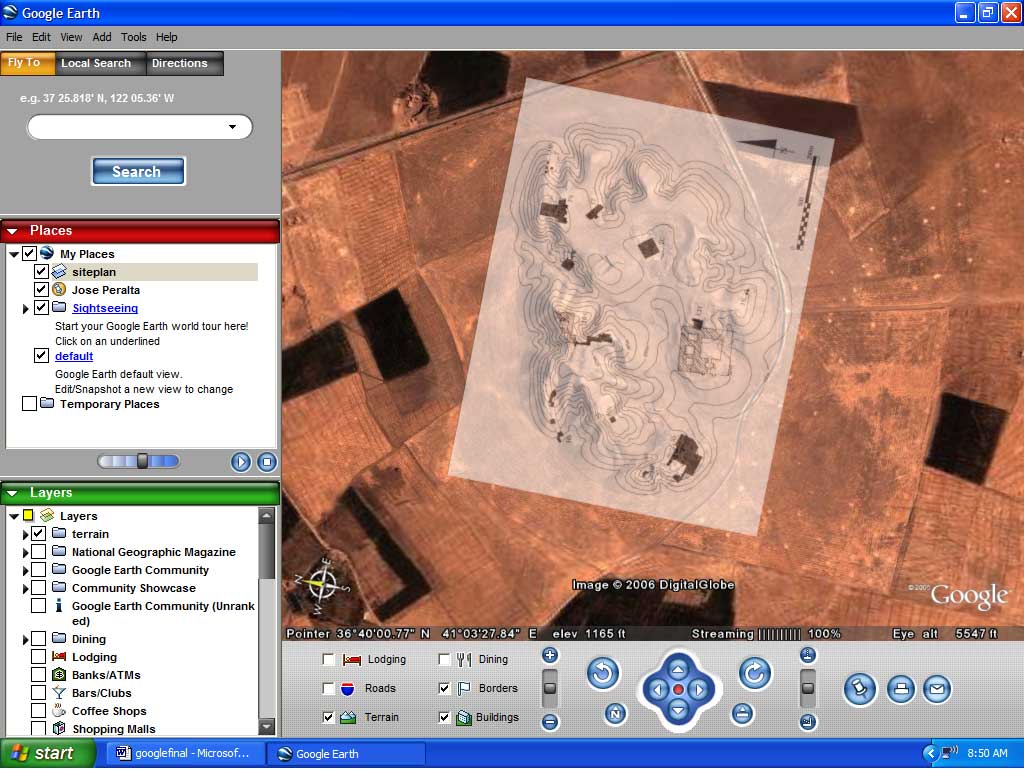
Fig. 7 - Archaeological plan overlay on Google Earth. Plan taken from: Excavations at Tell Brak, Volume 4. Edited By Roger Matthews, Fig. 1.2, Page 2 - credit to Google
In sum, the best part about Google Earth may in fact be that it is free, yet it offers users an unlimited number of possibilities for manipulating and working with archaeological sites in both their local and global location in the world. It provides quick and easy access to an enormous amount of mapping information and could potentially be an invaluable resource to a scholar’s tool kit. The program is designed to be extremely easy to use, and the more time you spend on the program the more tricks and more advanced applications you will learn.
If however, you are interested in a different source of data we would direct you to NASA’s Visible Earth at: http://visibleearth.nasa.gov/. NASA is limited by federal regulations, whereas Google is owner of the Keyhole software application and buys and distributes anything they want, so their data are different in terms of original source and scale. The images from NASA can be overlaid in Google Earth by the process mentioned above. An easy and quick way to search the images is by the modern-day countries option, which can be found on the right side of their homepage.
-- Lee Ullmann
Yuri Gorokhovich
To send comments or questions to either author, please see our email contacts page.
For other Newsletter articles concerning the use of electronic media in the humanities, or applications of GIS in archaeology and architectural history, consult the Subject index.
Next Article: Cross-Referenced Files and Blocks - Not for Scholars
Table of Contents for the Winter, 2006 issue of the CSA Newsletter (Vol. XVIII, no. 2)
 Table of Contents for all CSA Newsletter issues on the Web
| CSA Home Page |