
|
Karen M. Kensek
School of Architecture, University of Southern California
Watt Hall #204, Los Angeles, CA 90089-0291
(see email contact page for the reviewer's email address.)
Historians, archaeologists, curators, and others have struggled for decades with the problems of reconstructing buildings and artifacts without having enough data to be certain of their result. In an attempt to find appropriate methods of showing uncertainty, my students and I looked for methods for depicting missing or reconstructed data, visualizing multiple reconstructions, and showing the confidence level of reconstructions or parts of them. Although this work concentrates on digital reconstructions, it is not limited to those examples.
1. Preface
The realm of computer graphics in architecture has often been associated with new, high-end, futuristic design, curvilinear form, and use of ray tracing and radiosity for stunning visualizations. Although such work can be quite innovative, I have been drawn instead to the reconstruction of buildings that no longer exist, often historical buildings that may be hundreds if not thousands of years old. As a result, many of my students have modeled ancient buildings while struggling to find enough data to make plausible reconstructions. Together we learned what archaeologists already knew -- there never seems to be enough information available, and inferences, educated guesses, and just plain wild speculation can make their way into a reconstruction.
 |
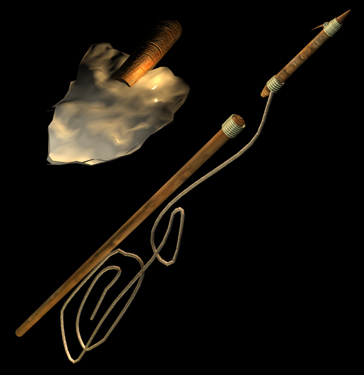 |
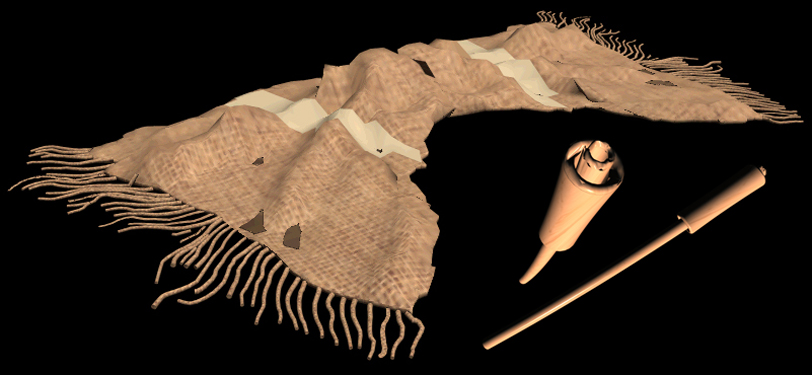
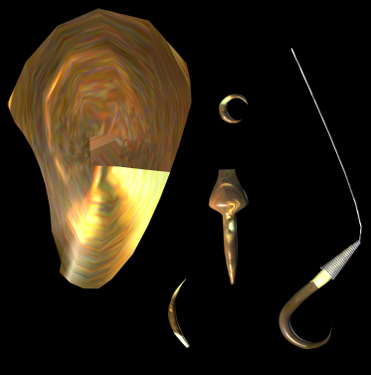
Figure 1. Student work: reconstructed ancient artifacts from Peru.
 |
 |
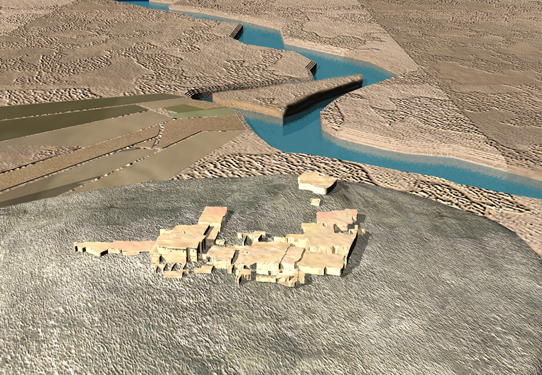
Figure 2. Student work: reconstructed ancient house and city in Turkey.
In addition to continuing our work on digital reconstructions, we are now also attempting to answer three questions: what techniques are used for showing missing or reconstructed data; what methods are used for showing multiple reconstructions; and how can one express the certainty of knowledge about the parts of the reconstruction? In this in-progress paper I explore some possible answers to these questions and pose new lines of inquiry.
 |
 |
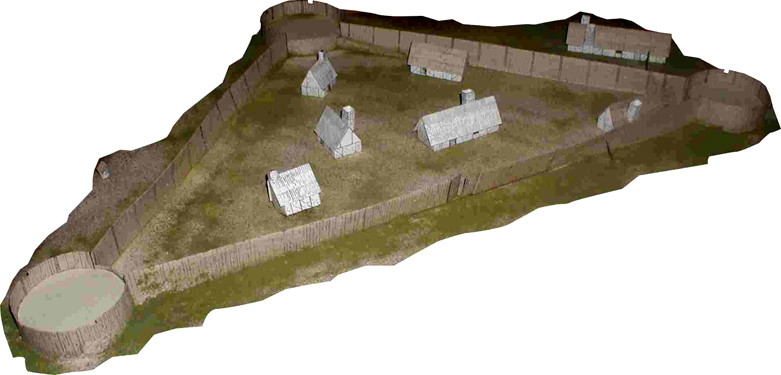
 |
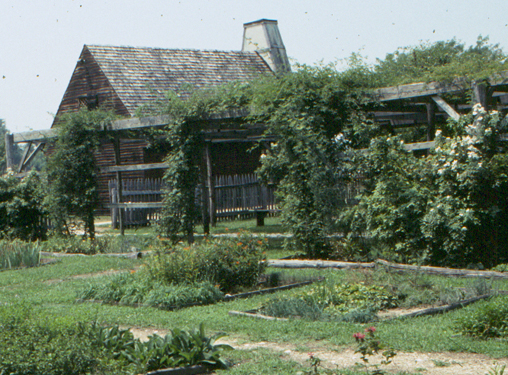 |
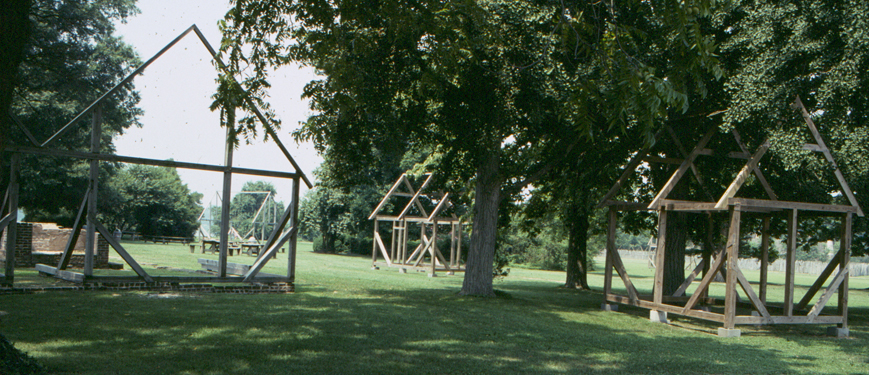
Figure 3. Historic St. Mary's City showing different types of reconstructions: real, re-built excavated foundations, "ghost buildings," and complete interpretation including gardens.
2. Introduction
Physical reconstructions are often excellent for portraying the lost past. Digital visualization can be just as valuable. A very interesting case study is described in Rendering Real and Imagined Buildings (Novitski 1998) concerning the pre-Columbian village of Ceren. In the Ceren project, computer models created by Jenniffer Lewin and architecture students at the University of Colorado helped uncover and demonstrate inconsistencies in the archaeological data. This lead to new ideas about arrangements of openings in the walls. This architectural example is one of many that could be cited demonstrating the usefulness of digital reconstruction.
The issue confronted here involves more than examining a final digital representation of historic architecture. It goes beyond the excitement of the compelling renderings and animations and explores the potential to mitigate the often unintentional deception in visualizations by linking archaeological recreations to the body of knowledge and assumptions that went into their creation. The problem is not usually with the intent but, ironically, with the wonderful methods that digital wizards have in producing life-like imagery. Even when every attempt is made to be accurate, the "finished product" might not be a correct portrayal of the past, but rather a single plausible interpretation. Without contrary evidence or explanation, it runs the risk of being perceived as authoritative and indisputable. (Eiteljorg 1998)
Even careful scholars can be seduced by realistic physical reconstructions and digital imagery that they can produce, failing to explain the range of certainties and guesses in their own representations. For example, whereas an archaeologist may know what the columns looked like at a particular temple (having found remains at the site), have a fairly good idea of the wall construction (from comparative buildings), and be a bit vague as to the roof of the building (some indications in text resources), the reconstruction of that temple might appear to be equally resolved at every level, even when the evidence for the different parts is not equal. In addition, the lines of reasoning that lead to the final choices might be buried deep in the footnotes of a scholarly journal. Although it is possible to ground these recreations through critique and citations just as we do with other research, often the information may not be readily accessible, especially for the non-scholar.
The magnitude of the problem expands when those recreating the past do not have a stake in separating fact from fiction and all nuances in between. Imagine for a moment the grandeur of ancient Troy on the big screen as envisioned by the film production designer Nigel Phelps -- massive stone buildings and towering statues of the gods, a place of epic proportions (Phelps 2004). Then consider what Heinrich Schliemann actually found in his excavations at Hissarlik, Turkey: small remnants of ancient buildings, short stubs of broken walls, shattered pots -- a far cry from the imagined state. And was this even the Troy of Homer? Since Schliemann, other archaeologists have also tried piecing together fragments of information to provide a plausible reconstruction of Troy as other movie makers have presented their audiences with their visions of the past. Ideally, a creation of a reconstruction occurs in a bounded relationship to a body of evidence linked to a past reality, whether embedded in the footnotes in a scholarly journal or presented as additional material on a bonus movie DVD. It would be interesting to compare the number of viewers who watched the Troy movie with those that went to the excellent website of current research done by archaeologists from the Institut für Ur- und Frühgeschichte und Archëologie des Mittelalters at the University of Tübingen and the Department of Classics at the University of Cincinnati. (Troy 2007) Of course, Hollywood is not the last word or most authoritative expert in historical reconstructions, but it can sometimes influence the public's perception more than scholarly publications. (Miller and Richards 1995)
Even when one wishes to show uncertainty about a specific reconstruction, it is often difficult to decide upon methods that are clear and instructive. This is not only a problem in architectural reconstructions. Many divergent fields, for example, art restoration, physics, statistics, and medical imaging can face similar problems. In this paper I attempt to provide a survey of techniques for showing missing or reconstructed data, alternative reconstructions, and confidence or uncertainty about the reconstruction. When methods are "discovered" that are not in common use in architecture, I hope to find ways to modify and apply these techniques for use in architectural reconstructions.
3. Caveat
While in the process of answering what I thought were three straightforward questions, it was apparent that I could not have found all possible techniques and that any suggested technique requires an appropriate example as a test. I invite readers to submit other techniques and examples to add to those that have been described, especially techniques from other fields or novel approaches.
4. What Techniques Are Used for Showing Missing or Reconstructed Data?
The problem exists in many fields: how does one represent what has been reconstructed versus what is real or known? In a very simple example, a museum curator has an ancient pot with a piece missing that she wishes to put on display. Should the gap be left empty, filled with another material, or recreated to look like the rest of the pot? Often the answer has to do with why the pot is being exhibited, for what audience, and whether or not enough certainty even exists to make a reasonable interpretation.
In some cases, the body of evidence from other examples might provide compelling evidence. For instance, a dinosaur skeleton in a natural history museum is missing a thigh bone; other dinosaurs of the same type have also been discovered, and an amalgamation can be constructed. Still it may be important that the viewers understand the process of reconstruction and the potential for errors (note the often cited problem of the Brontosaurus with the wrong head [AMNH 2007]).
In some cases the re-creator may need to deal with the issue of what to do if there is not enough data to support any specific reconstruction. The simplest method is to make no assumptions and instead leave the missing areas empty: keep the gap in the pot, support the dinosaur skeleton without the thigh bone, leave the manuscript with a hole in it, don't include the data point on the graph.
 |
 |
 |
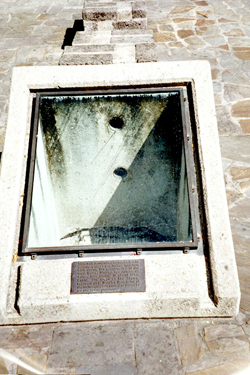 |
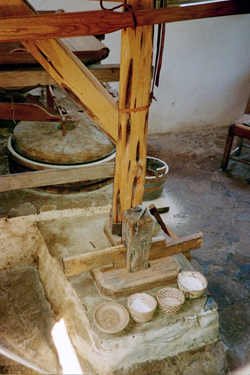
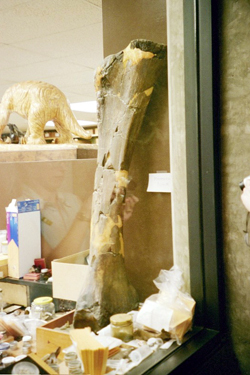
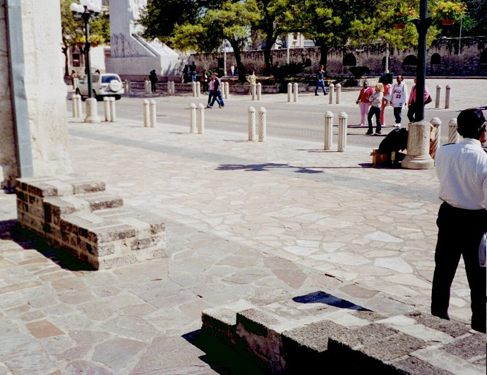
Figure 4. For the San Antonio mission millstone, don't distinguish what is real and what is not; in the case of the pot, dinosaur bone, and partial wall of the Alamo, don't reconstruct.
A second method is to rely solely on the viewers' perception of context and reality: it must be a reconstructed plant because a tree won't grow inside this room in the museum, the footprints on the moon can't also be here, an Egyptian temple is not 5" tall.
A third method is to be more direct. The missing or reconstructed data could be labeled with text: informational wording, a question mark, the phase "missing data", or even a historic method for maps, "here there be dragons."
 |
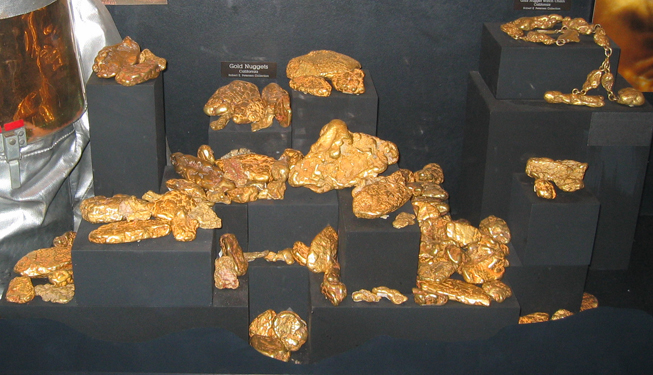 |
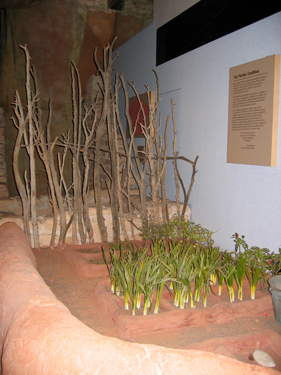
Figure 5. Reconstruction of Zuni waffle garden; by context it is known that the plants are not real. But don't be fooled, the gold in this exhibit is real!
 |
 |
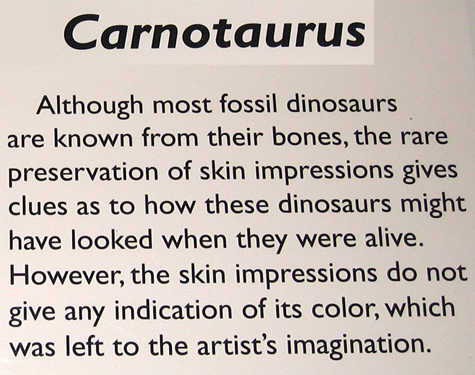
Figure 6. Labels and descriptions to inform the viewer.
Many methods rely upon visual techniques to show what is reconstructed versus "real;" these methods are usually applied to artifacts or digital images-. There are coloration schemes that rely on differences in color, shades of color, black and white versus color, patterns, hatches, or line types, materials (a common technique in museum exhibits where acrylic may be used to represent missing parts), rendering type, and transparency or opacity.
 |
 |
 |
 |
Figure 7. Use of white, shading, black, and color to show missing and reconstructed data.
 |
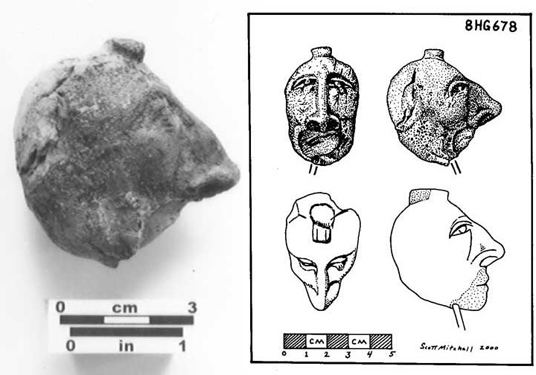
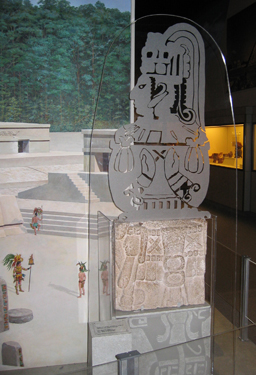 |
Figure 8. Use of hatching in effigy head drawing and change of material in Alamo wall and Mayan stelae.
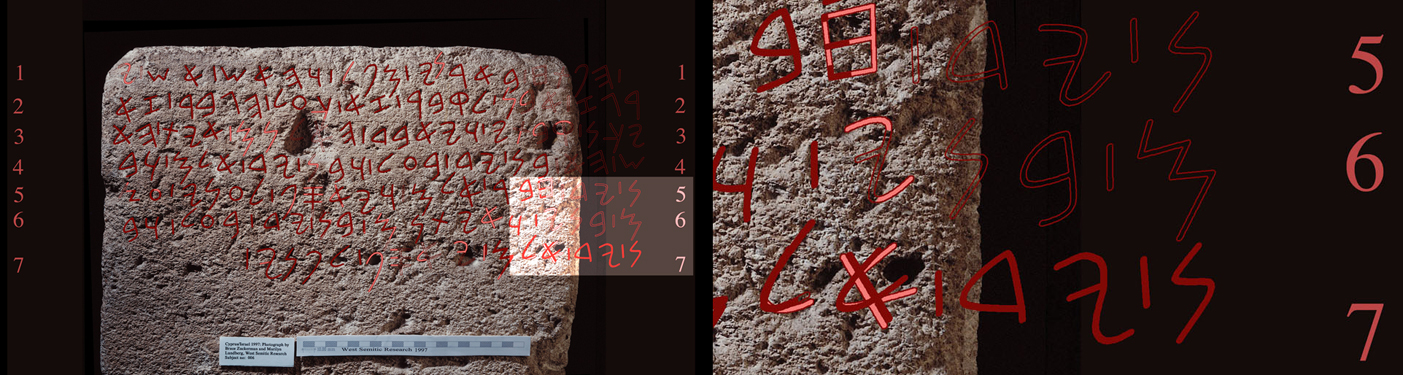
Figure 9. Interpretation shown by use of rendering technique; in addition, new words could be reconstructed beyond the tablets' edge because the text is formulaic in nature.
 |
 |
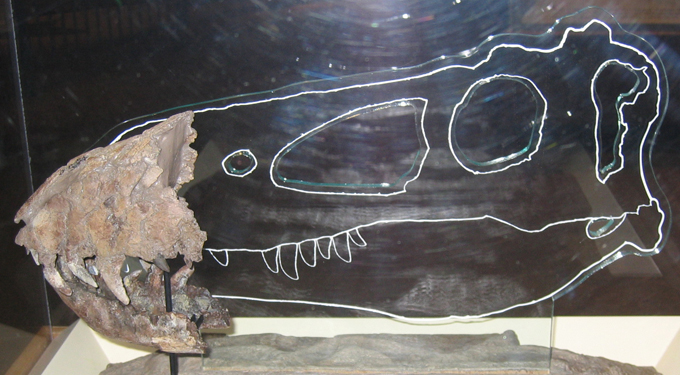
Figure 10. Examples of transparency for a dinosaur head and an Italian convent.
Filtering techniques exist that could distinguish the extant from the reconstructed, including fuzziness or blurriness, varying amounts of Photoshop effects (for example, twirl, ripple, emboss, solarize, grain, etc.), or changing the "density" of information being shown. Size distortion or dimensional characteristics (two-dimensional instead of three) and comparative schemes that show the reconstructed part offset or "exploded" from the original or use of projections or holographs for the reconstruction. Animation can also be used, from a simple case of blinking to having the objects move.
 |
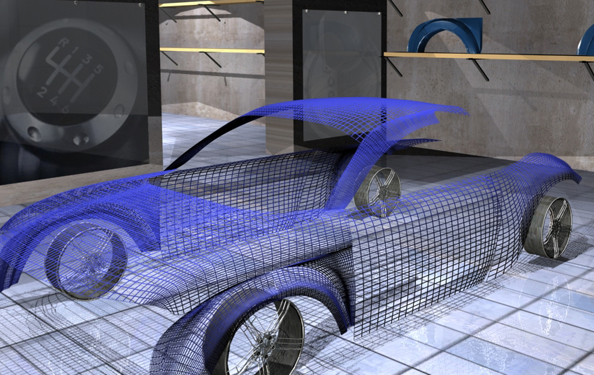 |
Figure 11. Photoshop sketch effect and mesh density examples.
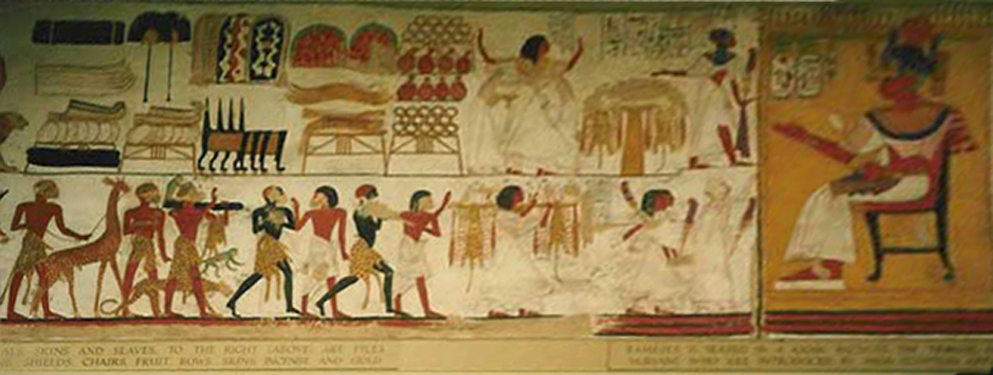
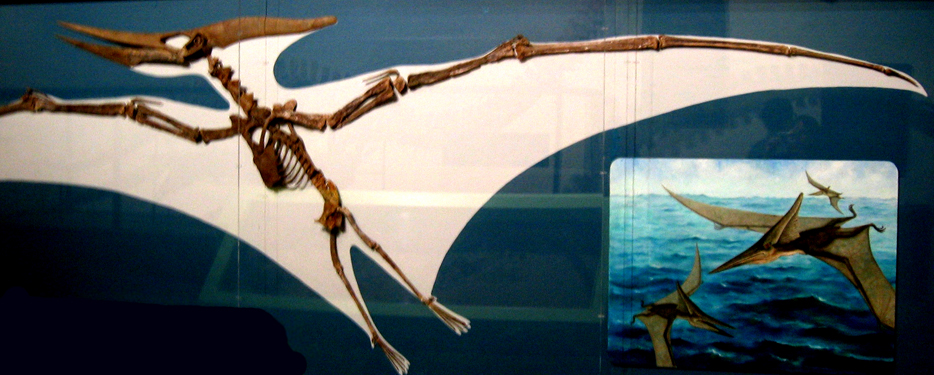
Figure 12. Egyptian mural demonstrating how reconstructed items could be shown at a different scale even though they are not used for that in this mural; an example showing the use of two dimensional graphics versus the three-dimensional skeleton.
 |
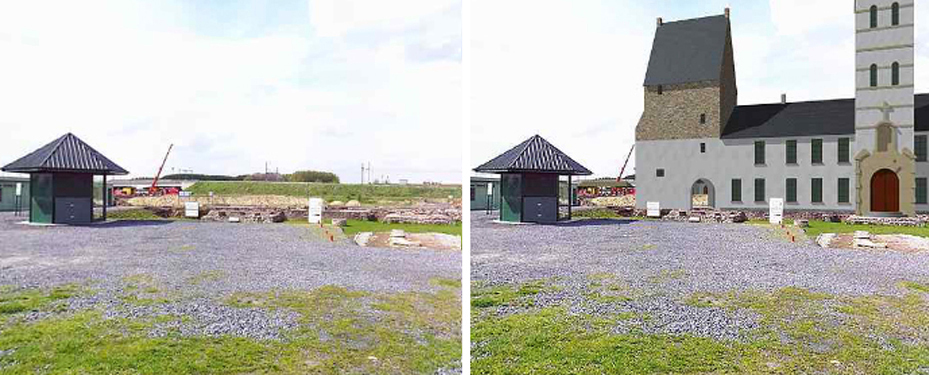 |
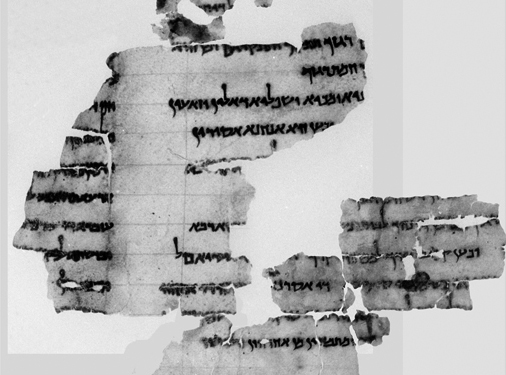
Figure 13. A gap between pieces of the Dead Sea scroll and QTVR overlayed on a real site.
In an analogous manner, one could use non-visual, sound-based clues: leave the unknown area empty (put silence where sound is missing), use a "label" (put the "missing data" sound or noise in where appropriate or a voiceover), or change the volume or vibrato of a reconstruction versus original. Although these are examples that pertain to sound recordings specifically, they can be used on interactive digital images. For example, as a user moves a mouse, the sound changes from static (reconstructed) to music (known) or a voice over explains the differences.
The sense of touch can also be manipulated to provide feedback between existing and reconstructed. Both with real objects (like a pot) or virtual objects (like a three-dimensional digital model of a pot), different types of haptic sensations can be used: for example, malleability (squishy / hard), texture (smooth / bumpy), and temperature (hot / cold).
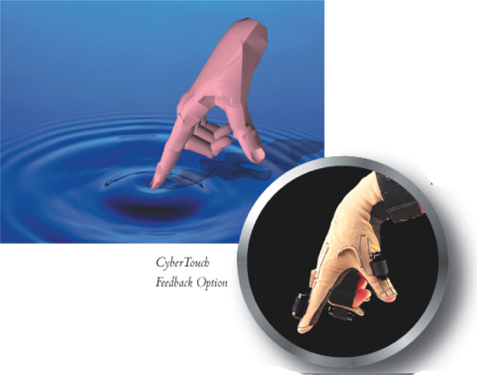
Figure 14. Demonstration of data glove for touch feedback.
There are also variations on these methods. With some of these techniques, the inverse can also be used -- for example a reconstructed artifact might be shown with more detail than the original, less transparent, brighter color. Multiple methods might be used to clarify what is missing or reconstructed, and multiple alternatives could be shown.
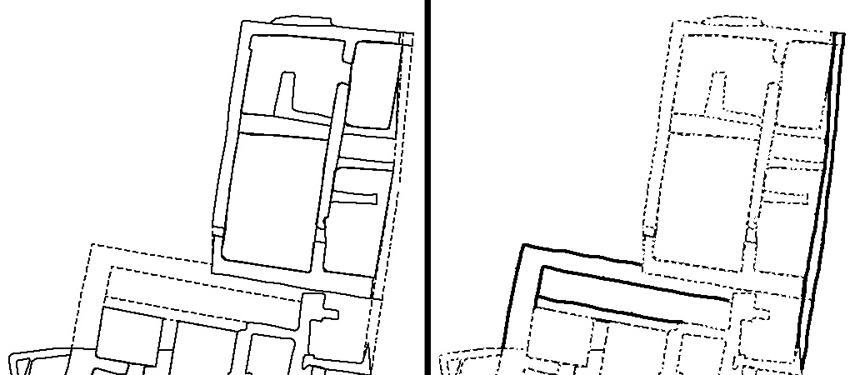
Figure 15. Inversion, usually dashed is used for missing data.
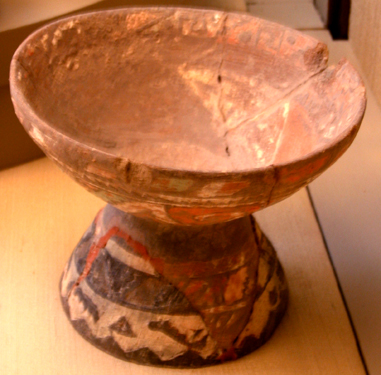
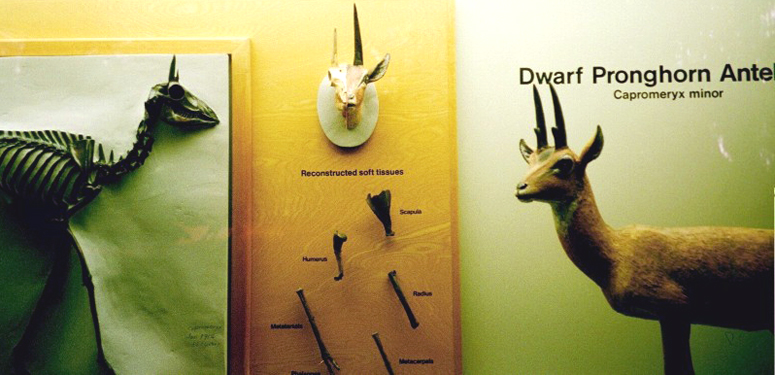
Figure 16. Multiple techniques used for pot (notice missing part and use of different material in joining pieces together) and antelope.
In some cases, it might be more clear to show the non-reconstructed artifact next to the reconstruction or use an image of the existing artifact as part of the new image.
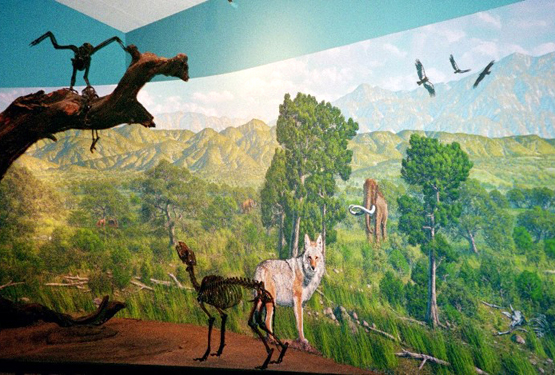
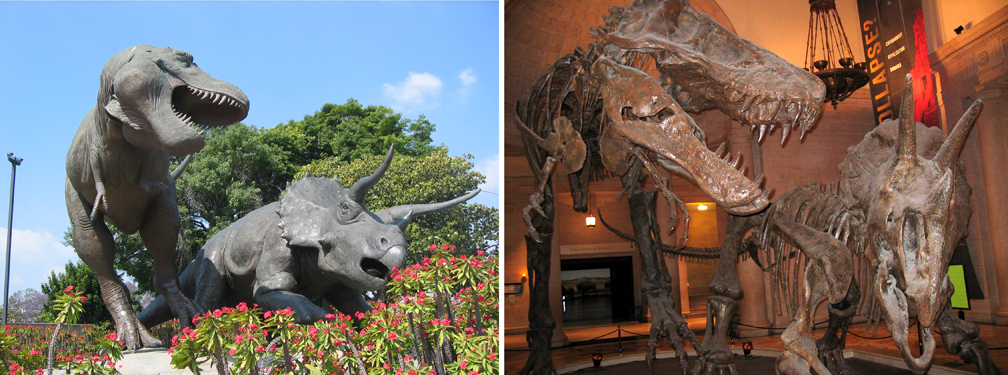
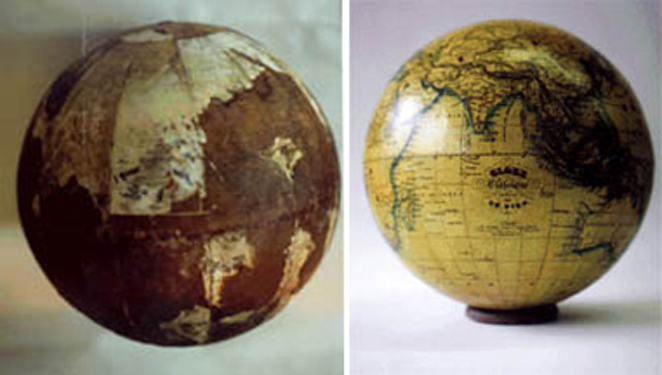
Figure 17. In each case the reconstructed is shown next to the original: Freeman House mold, wolf diorama, dinosaurs, and restored globe.
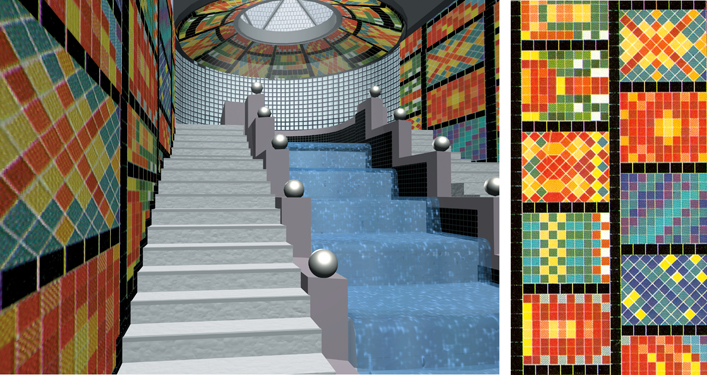
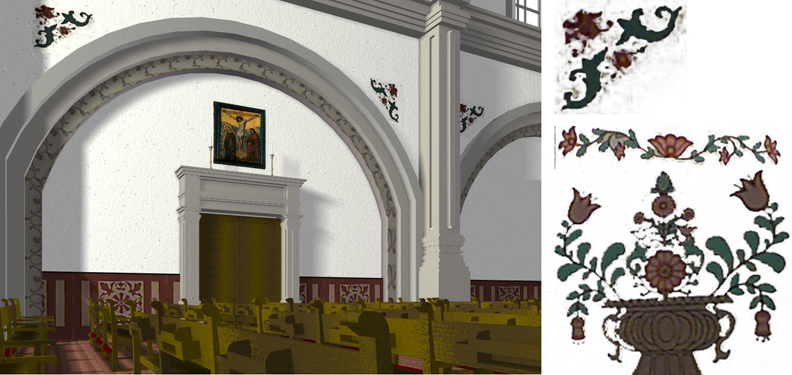
Figure 18. A small detail of the existing or comparable building was scanned and incorporated into the renderings of the Glashaus and San Juan Capistrano Mission church.
The reconstruction can even be in the same image, but shown in a different way: a castle's ruins are reflected in a pond where the full glory of the castle in its heyday is shown or in a more fanciful example, the young Anakin from "Star Wars" is shown with a shadow of Darth Vader, prophesying his future.
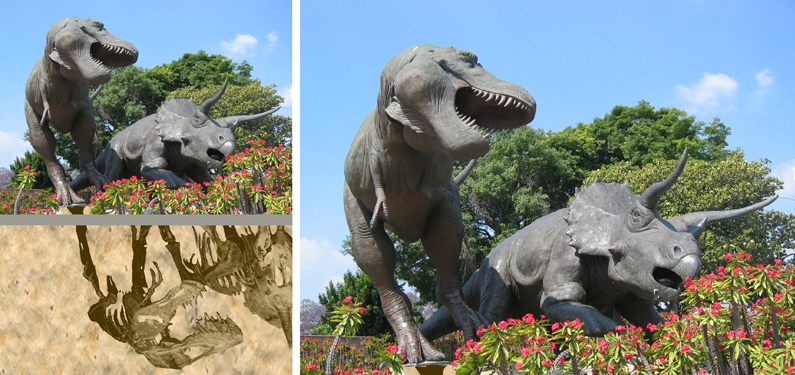
Figure 19. Photoshop manipulation to show skeletons as "shadows" of reconstructed dinosaurs.
The two images can be spatially concurrent: digitally as a rollover on a Web site or physically through the use of transparencies in a book. (A series of books put out in 2000 by J. Paul Getty Trust Publications exists for many ancient cities and demonstrates this technique.)
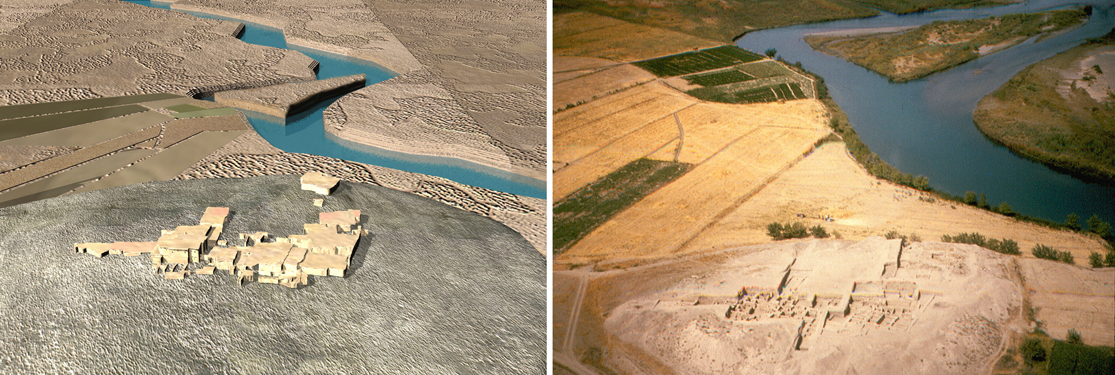

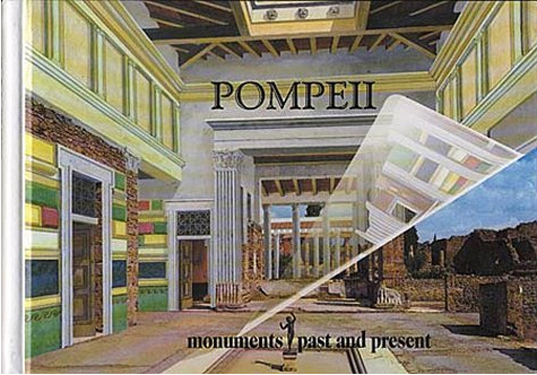
Figure 20. Rollovers for an ancient city, garden restoration, and images in a book.
Hybrid techniques such as having a projector send an image over the ruins or merging images from a real time projection with a computer generated reconstruction have been done (Ename 2005). And completely virtual reality worlds can be explored using head mounted displays or a simple mouse (Snyder and Paley 2001). As VR techniques become more prevalent for both archaeologists and the general public, the question still remains as to how to depict what is actually known versus what is conjecture and to what effect the intended audience affects this decision (Eiteljorg 2002).
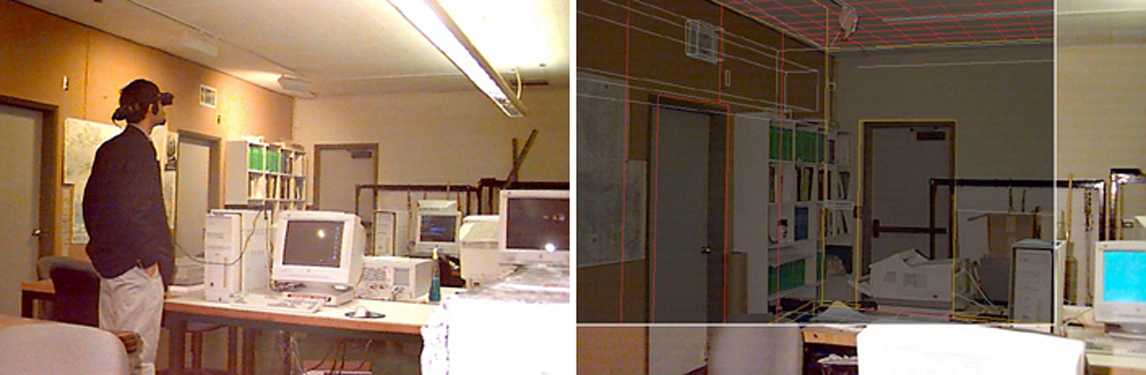
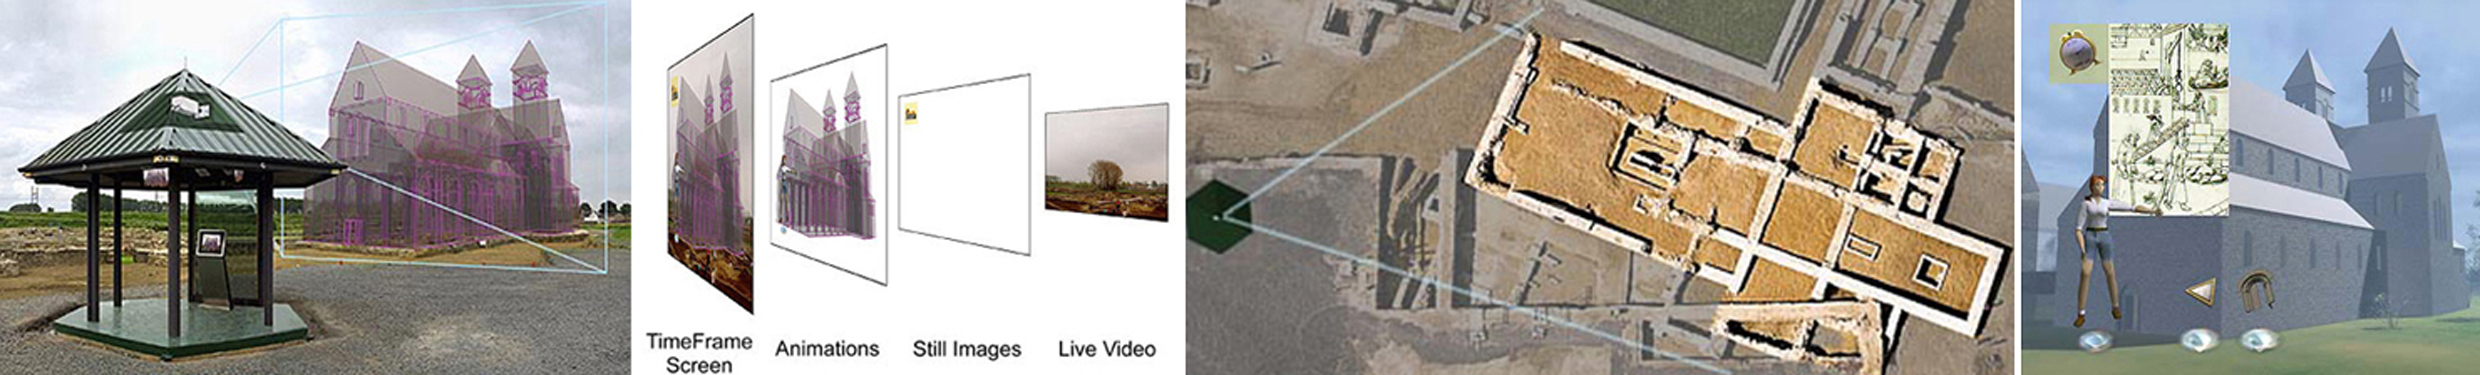
Figure 21. Digital goggles overlaying additional information in a lab; computer console showing reconstruction over building foundations with real time site conditions.
5. What Methods Are Used for Showing Multiple Reconstructions?
In addition to just showing the existing remains with one reconstruction, multiple reconstructions can be created. This not only gives the researcher an opportunity to portray many lines of conjecture, but it signals to the viewer that any single reconstruction is not completely certain. As with the previous examples (see figures 17 - 21) the interpretations can be adjacent to each other, concurrent in time, as a series of images or physical models. Or they can be sequential: pop-ups appearing in a Web site, an animation, a movie movie where the user controls the timing, or virtual worlds that could be explored with head mounted displays or a simple joystick. It is also possible to wander through several worlds, each based on a different hypothesis and set of assumptions (Sideris, Roussou, and Gaitatzis 2004).
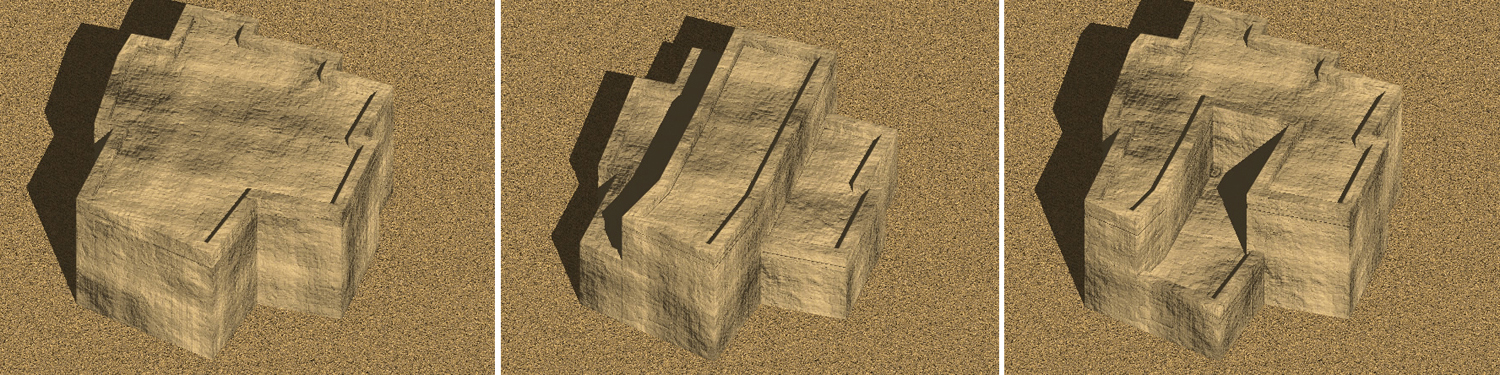
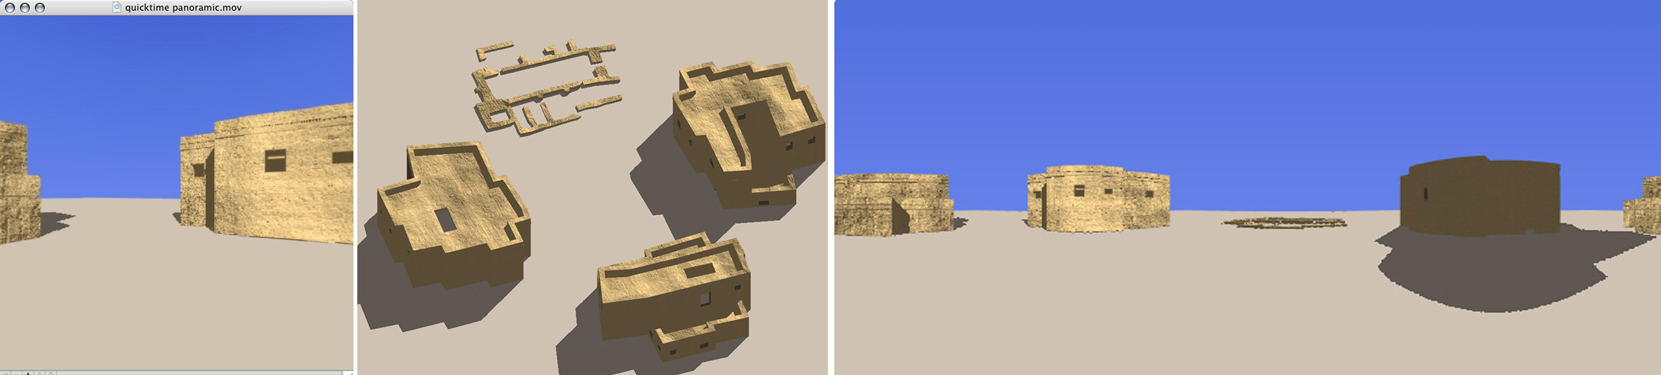
Figure 22. Multiple reconstructions of a Turkish house shown adjacent and also as a QTVR panoramic movie where the viewer moves the mouse to go between alternatives.
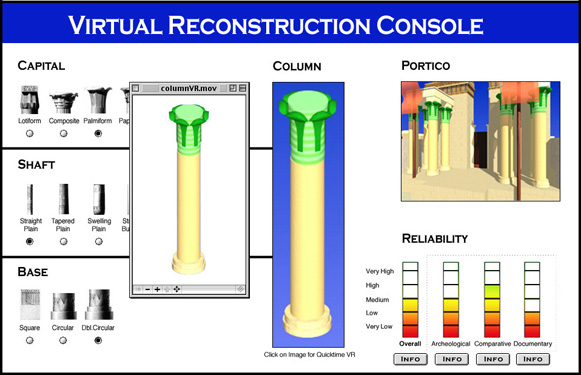
In some cases users can define which specific reconstructions to exhibit from a set of possibilities: an interactive console that would allow them to pick subsets and combine them, for example, choose a column type, roof type, and window type and apply those selections to a building model.
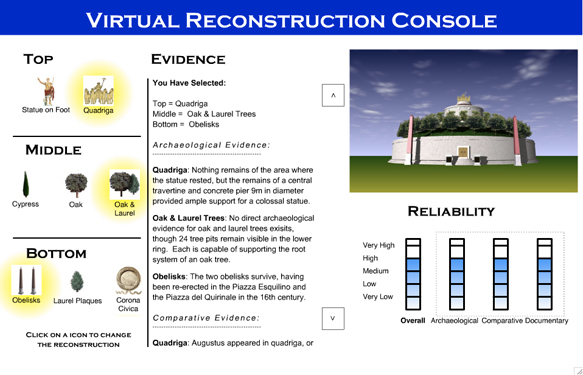
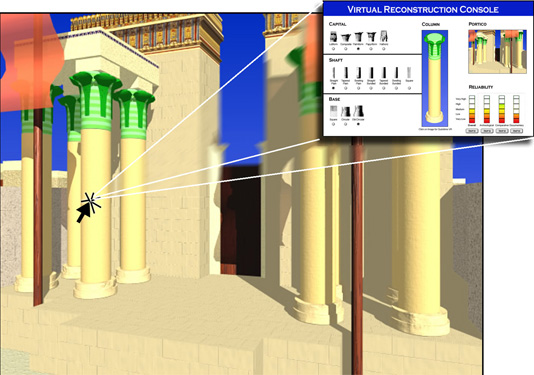
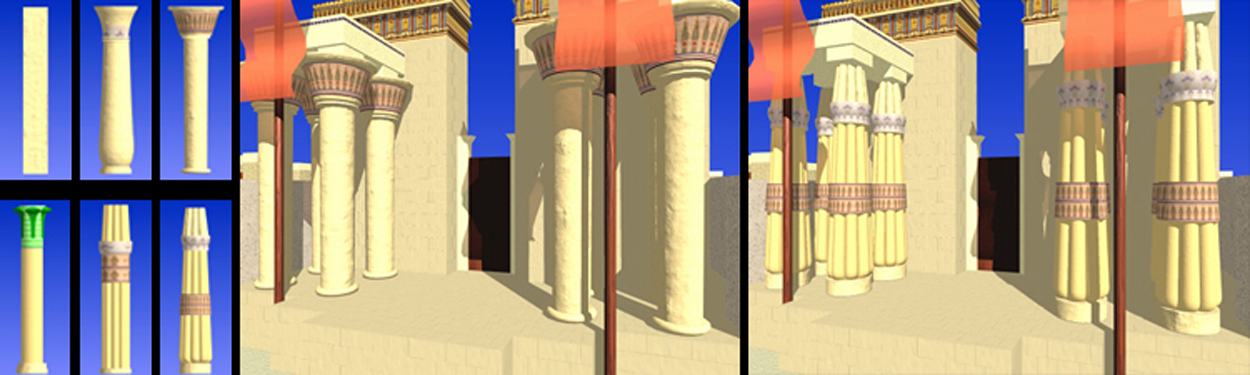
Figure 23. Flash and html consoles that allow users to select parts of a building and then visualize the results.
In rare cases, it might also be able to show "all" possible combinations: given a finite number of column bases, shafts, and capitals types, a morphology of columns can be constructed that theoretically includes not only the "correct" reconstruction, but all other possibilities. Or one can use a Zwicky box with independent variables to create many reconstructions that may or may not have existed to generate ideas. This leads to the next question, "Can it be shown how confident or certain the creator is about a specific reconstruction or the different elements that make up a reconstruction?"
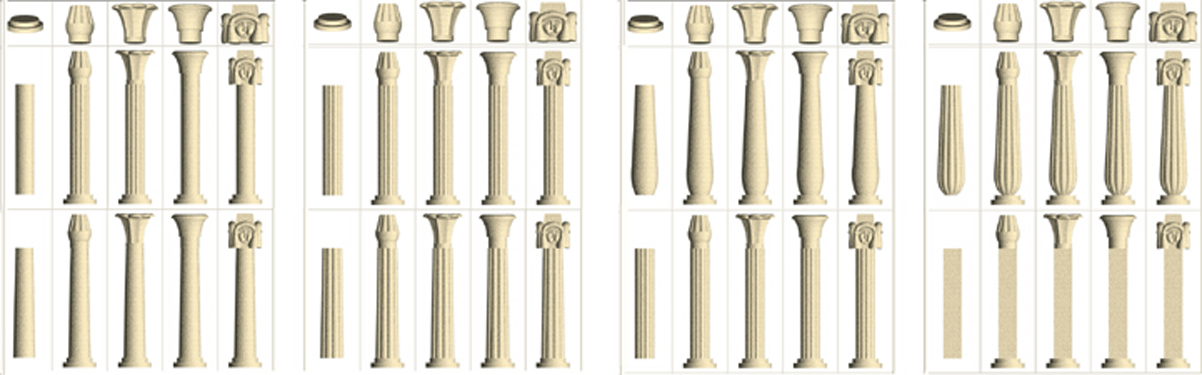
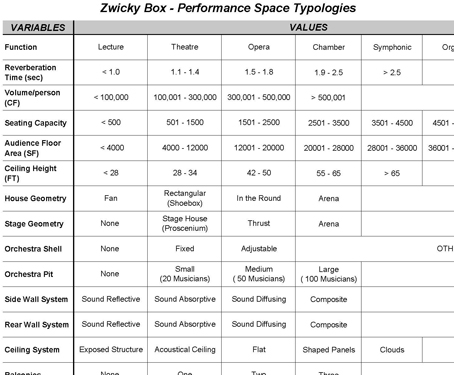
Figure 24. Morphology of Egyptian columns assuming one base type, eight shafts, and four capitals; Zwicky box of acoustic treatments looking for new combinations.
6. How Can one Express the Certainty of Knowledge about the Parts of the Reconstruction?
Many techniques for showing missing data and multiple reconstructions have been discussed. Assuming that a reconstruction is made, it is created with a set of assumptions that may be obvious to the reconstructor but not to those who later view the final project. As a simple example, an archaeologist finds shards of a pot and reconstructs the shape of it. He has detailed knowledge of the shape of the pot (although extra shards and missing shards provide a little bit of uncertainty), some good guesses on the colors used (extrapolated from known examples or even from pigments on the fragments found), and maybe limited knowledge about the complete pattern (based on other comparable pots from the same culture). Or an archaeologist knows exactly where the foundations of the building are located, has some idea of the materials used for the construction of the walls, assumes from other excavations where the doors are located, but has a low level of confidence for the shape of the roof. How can she provide to the viewer a sense of not only the possible alternatives, but also her levels of confidence about the reconstruction(s)?
Many techniques can be used to depict the confidence of the reconstruction; several of these are very similar to the methods for showing reconstructed data, especially those that rely on visual, aural, or tactile clues. In the simplest case, however, no confidence level is given. Equal weight is given to all parts of a reconstruction and the alternatives; viewers can compare against the original material to make their own determination of accuracy and likelihood.
 |
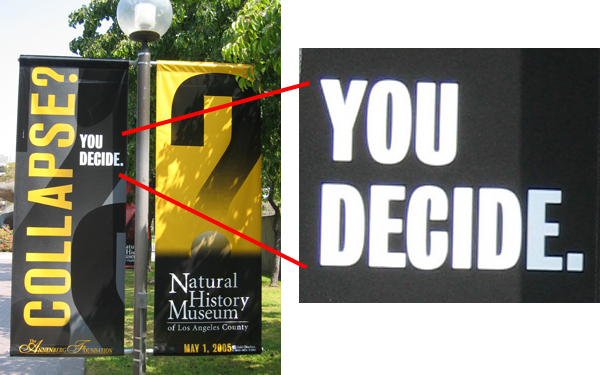 |
Figure 25. No distinction is made or explanation given.
Text-based systems can be used. One can use labels that imply uncertainty: artist's rendering, circa, likely, probable, possible, unlikely, doubtful, etc. Different languages may indicate varying levels of exactness in the specific words (see Extreme Guides 2005 for a Japanese example). A time-honored academic method is to include written material often in the form of endnotes or footnotes. This idea can be expanded in the age of the Internet by using pop-ups and hyperlinks to websites that can show evidence for the level of validity of the reconstruction.
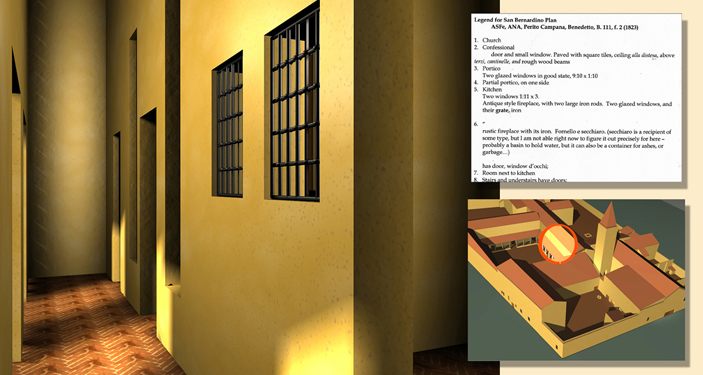

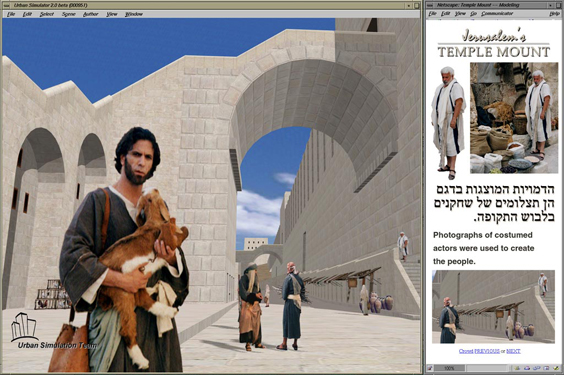
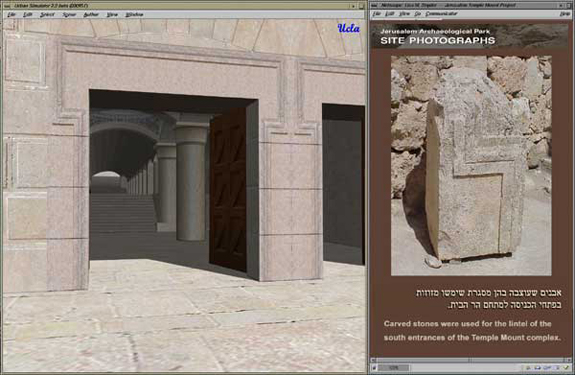
Figure 26. Web pop-ups: convent non-functional prototype, school hyperlinks, Jerusalem's Temple Mount with pop-ups giving additional information about the people and existing architecture elements.
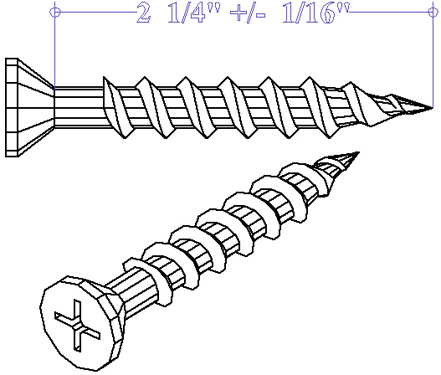
Various alternatives can also be rated with percentages (75 % certain that the column was Doric), ordinals (1, 2, 3, ... ranking), and grades (A, B, C, D, F). Statistical uncertainty methods and sampling errors provide more detailed analysis; in some cases they can still be confusing, take weather forecasting for instance. Although specific definitions do exist for partly sunny and 30% chance of rain, the average person may not know of them (http://nws.noaa.gov/glossary/). Plus and minus error ranges, for example those used for tolerances on engineering drawings, use of significant figures (650 million years ago, 2.50 seconds), and ranges (35 - 40 degrees) also indicate uncertainty within specified bounds. Many of these methods may be translated into more visual depictions of confidence levels.
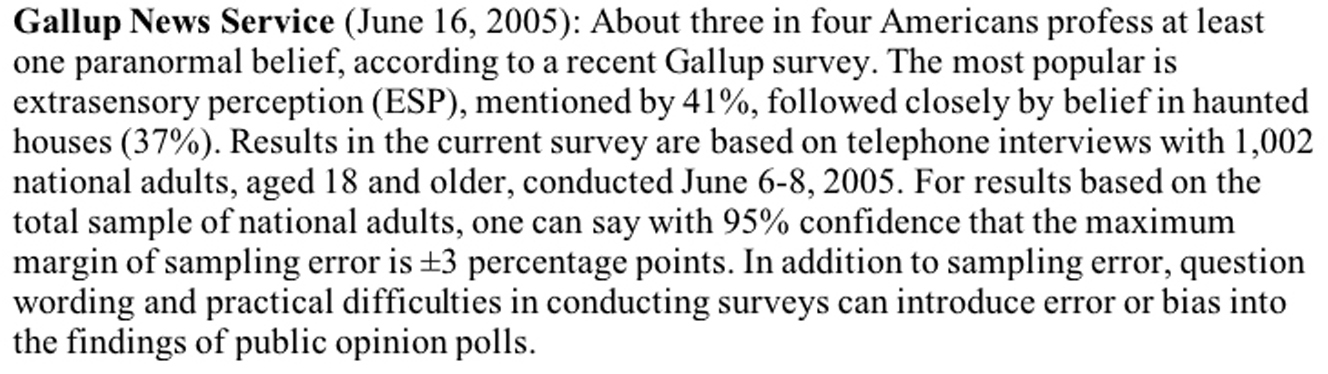
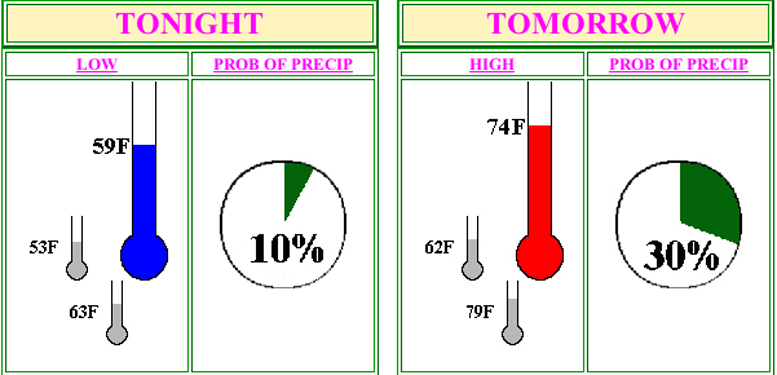
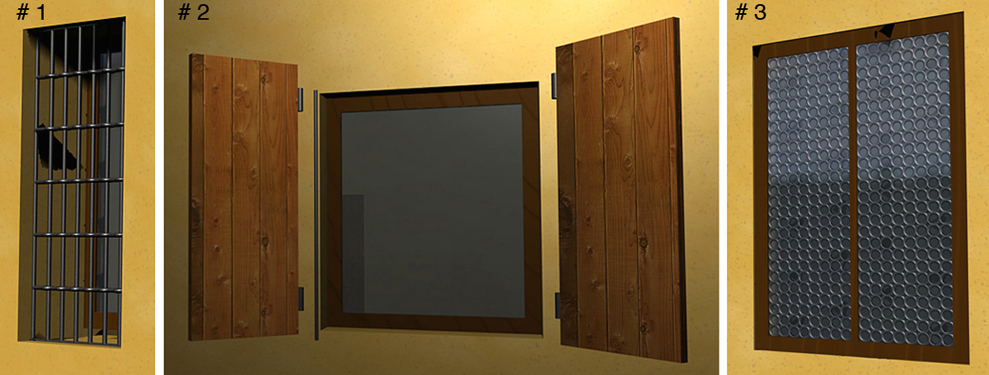
Figure 27. Statistical uncertainties; ordinal ranking on the window alternatives.
 |
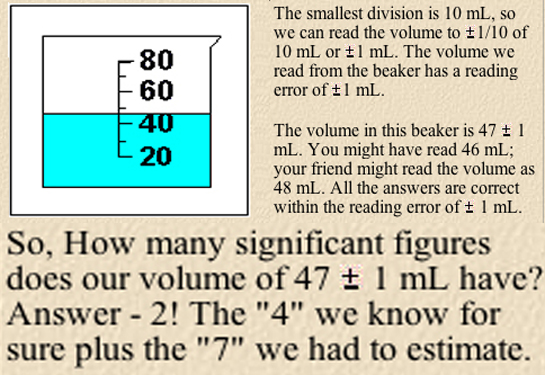 |
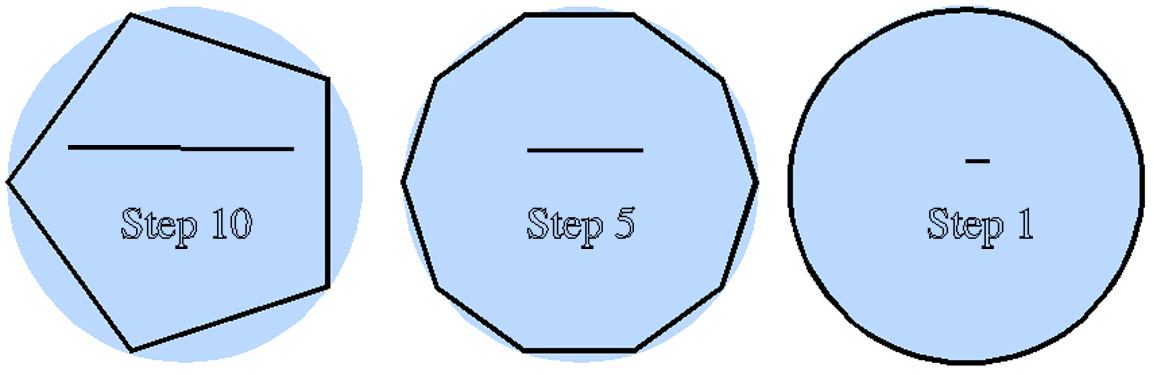
Figure 28. plus / minus tolerance, significant figures, and accuracy based on smallest unit used to draw the figure.
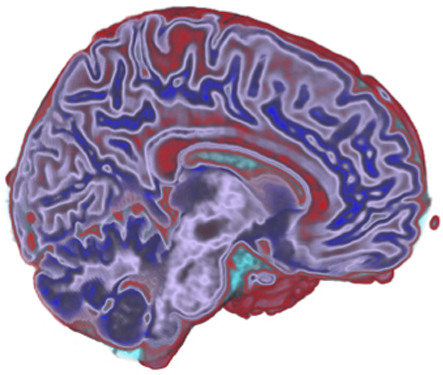
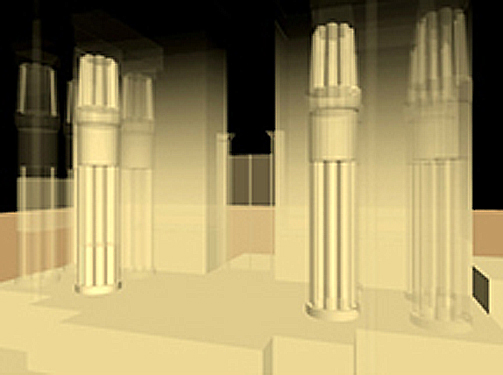
Visual methods for presenting uncertainty include (1) "coloration" schemes (colors, for example, green confident, yellow medium confident, red not confident; shades or saturation of a color; black and white versus color) (2) patterns, hatches, line types; (3) materials; (4) rendering type (see article by Strothotte, Masuch, and Isenberg 1999); and (5) transparency (opaque confident, different levels of transparency for less confident). The methods need not apply only to two dimensional images. An interesting idea was that of "ghost buildings" at historic St. Mary's city in Maryland where just the outlines of the buildings were constructed as skeletons over the locations of the foundations that the archaeologists discovered.
 |
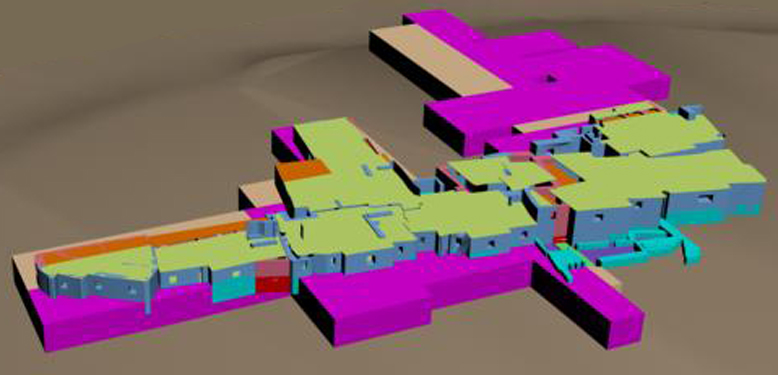 |
Figure 29. Color as a method of showing confidence for a brain MRI and city reconstruction.
 |
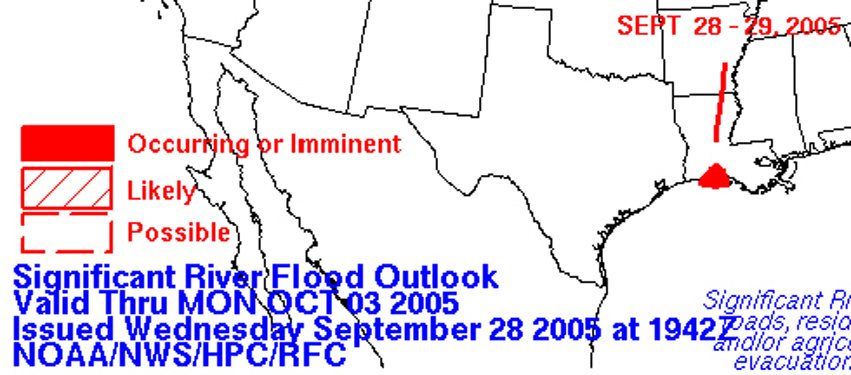 |
Figure 30. Materials (chipboard versus paper) in a model of Jamestown for different levels of conjecture; hatching on USA map to show likelihood of river flooding.
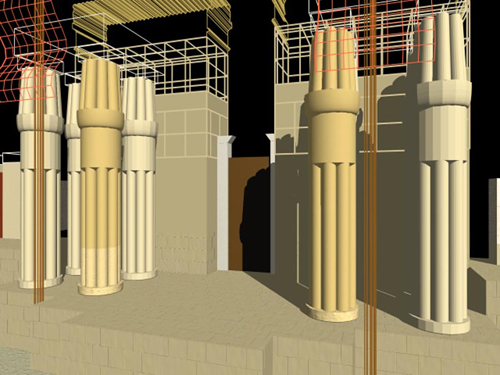 |
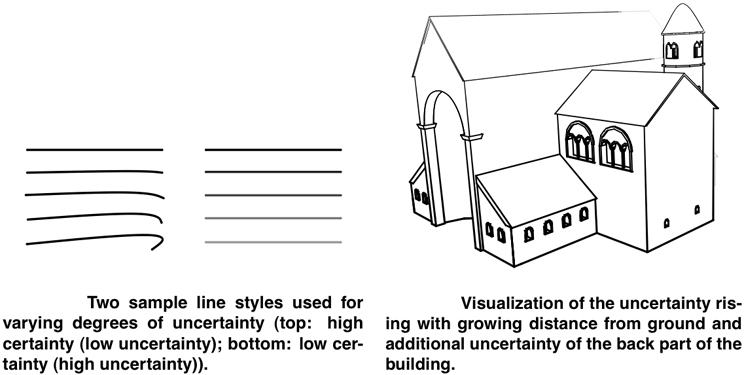 |
Figure 31. Rendering techniques.
 |
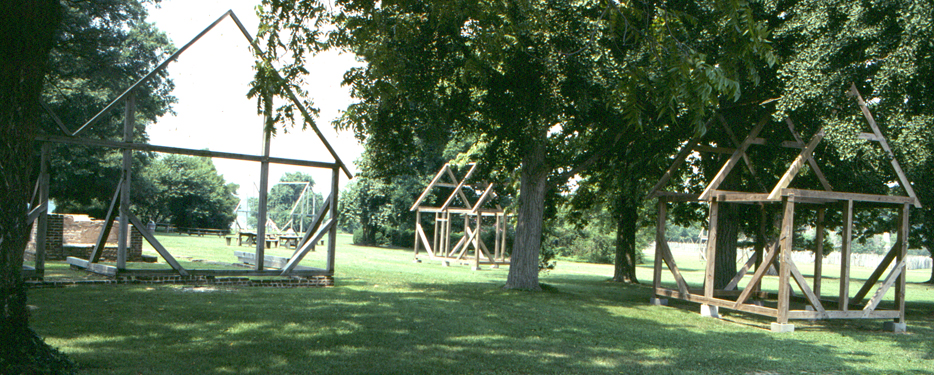 |
Figure 32. Use of transparencies.
Visual filter schemes can be used as well: varying the application of Photoshop effects (like twirl, ripple, emboss, solarize, grain, etc.), different clarity or fuzziness (used both to blur less confident areas and in the case of electron orbitals, to indicate possibilities for the location of the electron), or depicting levels of density of information. Size distortion schemes can be confusing, but by making parts of a reconstruction bigger or smaller, one could demonstrate the confidence level of each piece. Although potentially difficult to understand, one could use different "dimensions," for example part of the image could be in two dimensions (a plan view) while another part with a different confidence rating could be in three dimensions (axonometric or perspective view).
 |
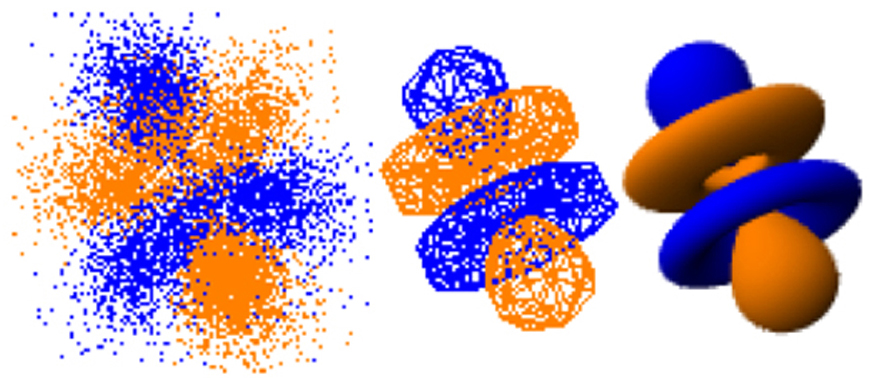 |
Figure 33. Less clarity or density of information; electron probability orbitals.
Other options include animation, blinking, or toggling between values (as a voltage meter does when it is uncertain about the last digit of accuracy); graphing techniques including error bars, scatter plots, and histograms; and using symbolic certainty (as is the case of stamps or seals that are put on bottles to verify that they have not been opened or tampered with).
 |
 |
 |
 |
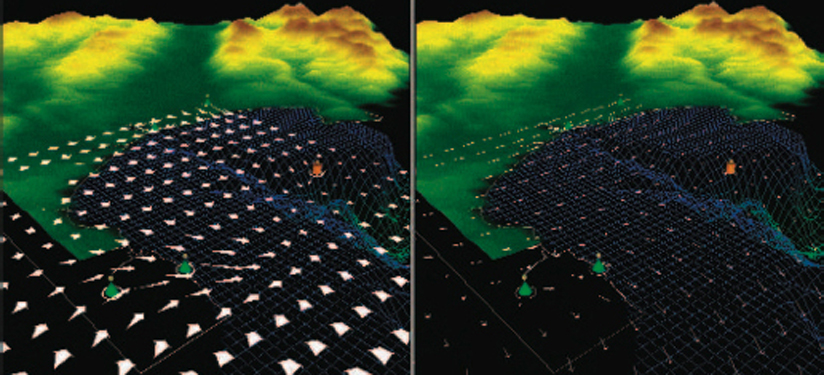
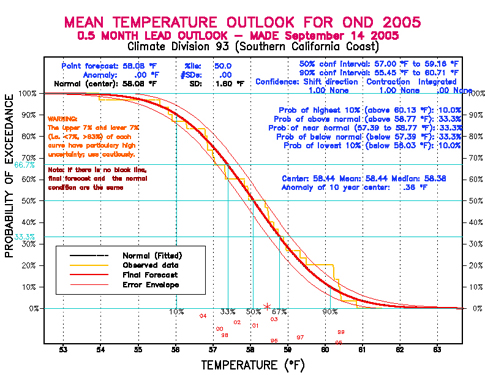
Figure 34. Temperature error bars (fictitious); volt meter readings; seal on bottle; error envelopes for temperatures and hurricane path; visualization of wind direction showing both uncertainty direction glyphs and regular arrows.
Sound can be used in a variety of ways from a simple toggle of music versus noise (known / unknown) to a voice over (for example, as one moves over a roof on a reconstructed temple, a voice explains that the roof of that temple no longer exists, but from the size of the columns, knowledge of local building methods and materials, and drawings in contemporary sources, they are very confident that it was a wood framed, wattle and daub flat roof). Pitch, vibrato, and loudness can also be used to signify the certainty level. Tactile methods have been discussed earlier; these include malleability (squishiness / hardness), texture (smoothness / bumpiness), temperature (hotness / coldness), and tactile feedback. For example, in the case of tactile feedback, it would be possible to have a viewer interact virtually with a window; as he moves the window in different locations on a wall, it "pulls" itself back to the locations where the archaeologist thinks that the window was most likely located. Systems have already been developed that do this with molecules (Phillips 2002).
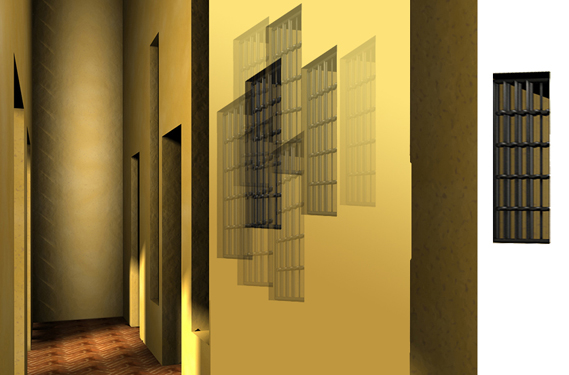
Figure 35. Conceptual drawing showing how a window could "pull" itself into more likely positions on the wall.
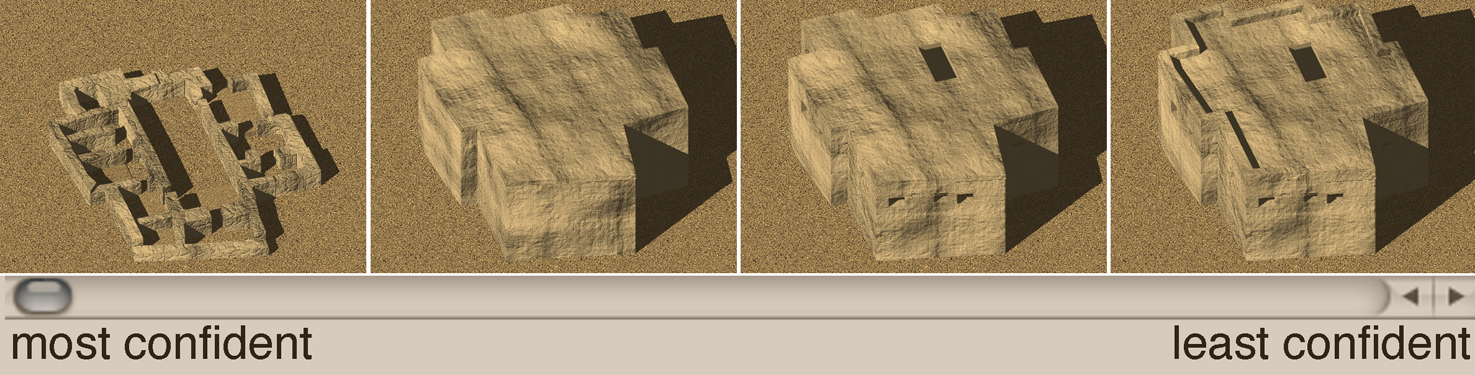
When creating multiple reconstructions with differing levels of assuredness, there are other opportunities. A confidence slider bar could allow users to change from existing data to less confident and more confident alternatives. Confidence bars could appear for each version or for parts of the reconstruction. Or something like Flash or even PowerPoint could establish the timing of images, going from least to most confident and perhaps including the parameter of how long the image is actually shown on the screen from very short to much longer.
 |
 |
Figure 36. Confidence sliders and bars.
Variations on all these methods exist including inverting any of the characteristics (translucent means confident, opaque conjecture), changing the weighting of the factors, and using multiple methods (perhaps with text and visual parts). Clarity, appropriateness, and establishing the goal of the reconstruction can help in determining which methods to use.
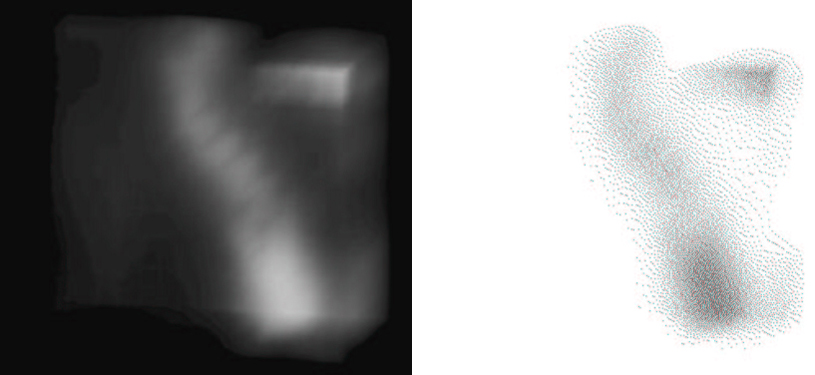
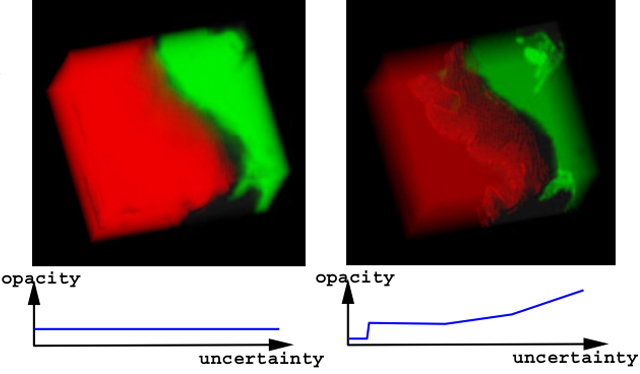
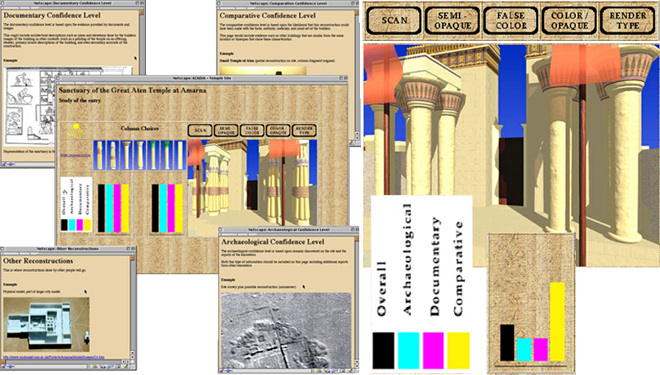

Figure 37. Inverting of black and white image; changing opacity non-linearly to make uncertainty clearer visual; multiple methods including pop-ups and hyperlinks, confidence bars, and multiple reconstructions; transparencies and color.
7. Work Remaining
In this paper I have discussed different techniques for reconstructing missing data, showing multiple reconstructions, and incorporating confidence levels into the visualization. I am currently looking for more methods to include, especially from fields outside of the graphic arts (see Johnson and Sanderson 2003 and Shneiderman and Pang 2005 ) Often the issue is finding novel approaches; sometimes the problem is as simple as just trying to find a clear example. When it is reasonably certain that I have "discovered" most of the common methods, not only do I hope to continue looking for more, but that we will also find ways to transform these techniques into modes that can be used specifically for architectural reconstructions and modes that can deal with the idea of representational ambiguity.
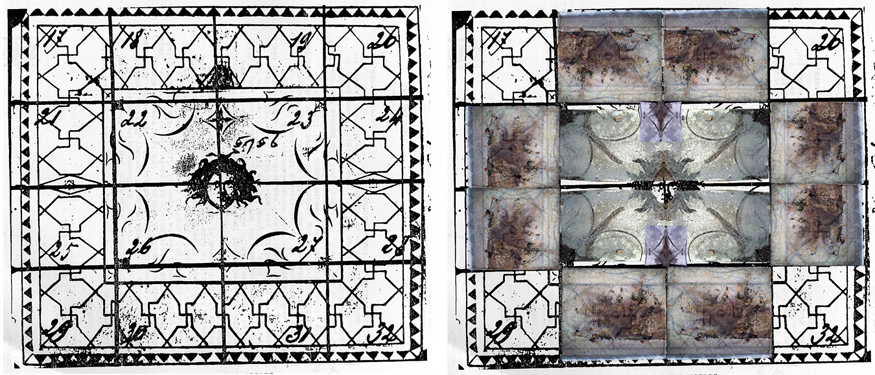
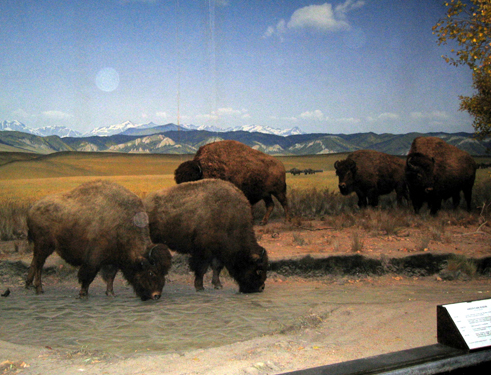
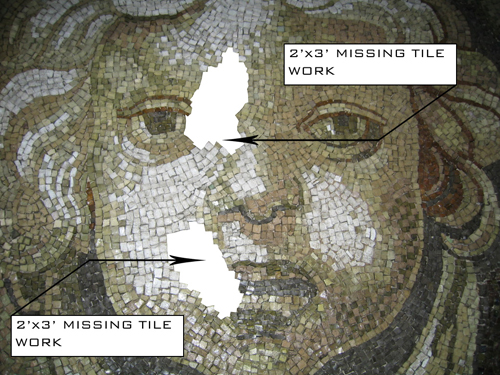
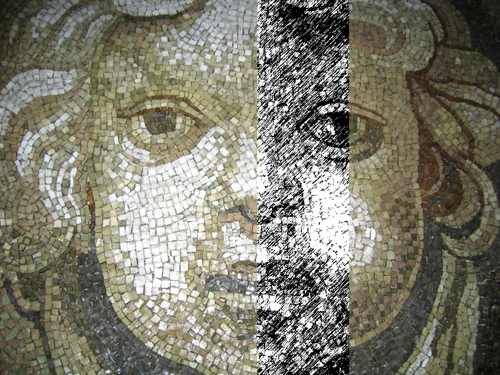
Figure 38. Photographs of parts of an actual mosaic manipulated and placed on top of reconstruction diagram; mixture of real and fake materials to recreate buffalo diorama.
There are other important issues that are being studied by others. Some of these are what year to reconstruct to, appropriate use of techniques, methods of linking data with images, and applications beyond visualization.
Historic preservationists encounter many issues that could prove useful for digital reconstructors to understand. For example, when restoring a famous building, the issue of which period to restore becomes important, as it is often impossible to show more than one reconstruction. And should a viewer be able to tell the difference between remade objects versus original artifacts even if the distinction would then detract from the users' perception of the space. One moderate compromise technique is the 10-inch rule where looking at a wall from a distance, it looks historical, but from less than 10 inches away, one can immediately tell what is original and what is not.
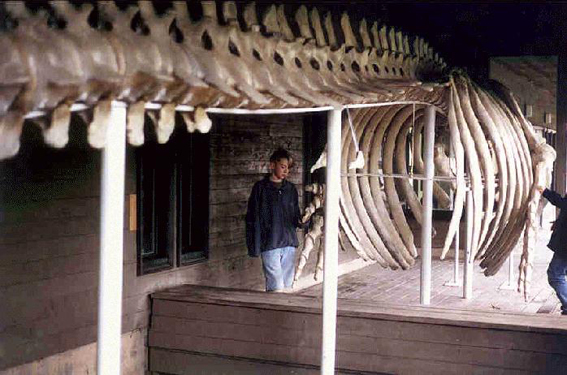
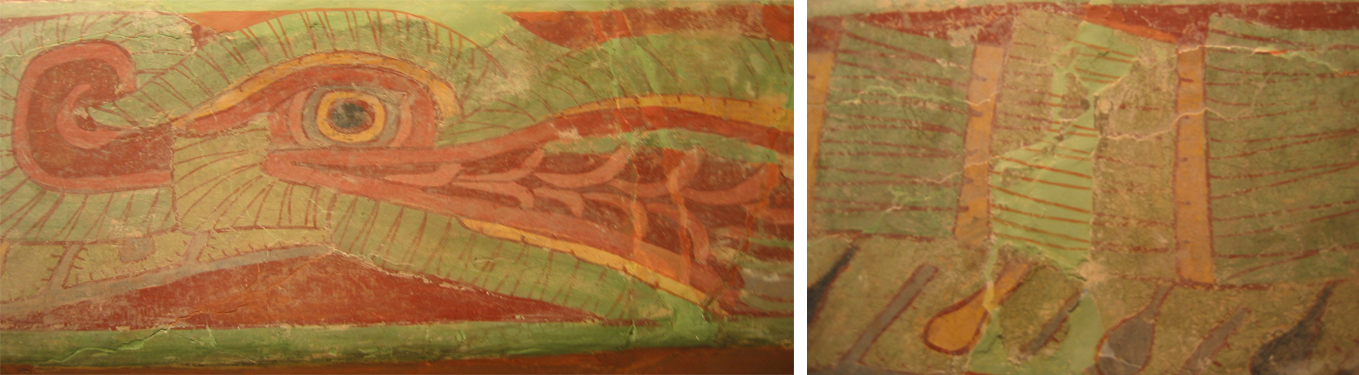
Figure 39. Part of a rib of the whale and small sections of a Mayan wall mural are made of different materials; these are apparent close up but not further away.
A historic preservationist's creed might include preservation first, then rehabilitation, restoration, and finally reconstruction. By analogy, perhaps a digital reconstructor should show most prominently the real material, then attempt to fix minor details, patch major areas, and finally create missing parts, while clearly creating a visual "paper trail" of changes and assumptions. Consideration should be given to the best and appropriate use of the methods especially with regard to the intended audience. Allowing the reconstructor to mix and match the techniques as necessary may prove to be the best solution in the long term. Further study is essential in learning about the other techniques available for deciding when and how.
In many cases, what is needed is a method to connect the graphics versions of three dimensional objects to written information about them. Before the invention of the computer (and sometimes even continuing into the present!), this might have been done with a code number on the object that served as a link to a folder in a file cabinet. Digitally, this is entirely possible with reasonable CAD programs and layer name conventions or CAD used in conjunction with commonly available database management systems (Eiteljorg 2002). It is more difficult to attach the data within a high-end modeling and rendering software package. Even more sophisticated, highly customizable, and often easier to develop with respect to data management, a geographic information system (GIS) could be used for tracking both graphic and non-graphic information; they are already in use as a method of tracking archaeological data on site (Forte and Siliotti 1996).
 |
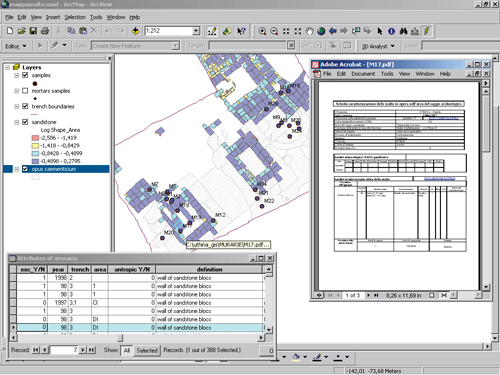 |
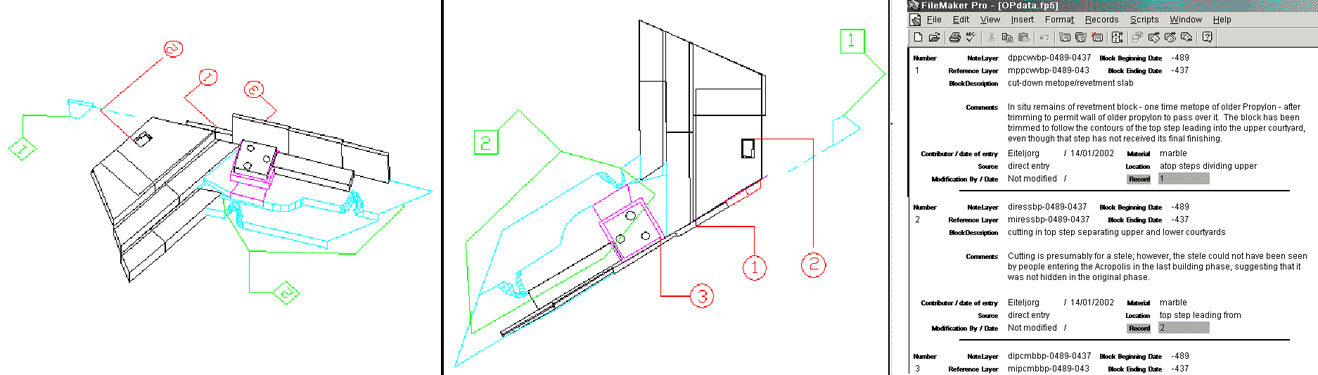
Figure 40. Different techniques of attaching data to graphics: use of a spreadsheet, GIS, and AutoCAD to database.
As a final thought, a reconstruction need not only be visual. Although this paper concentrates on graphic representations, one could recreate with an emphasis on other sensory inputs, with aural, tactile, gustatory, and olfactory characteristics: music as heard in the Parthenon, the texture of cobblestones through a Roman town, the taste of an Elizabethan feast, or the smell of a Gertrude Jekyll garden in the spring. Emphasis might also be shifted from producing "realistic" images to recreating an experiential feel, for example, of an Aztec temple from the point of view of the sacrificial victim (Serrato-Combe 2001). Because people have a strong connection to how things look and computers can manipulate digital images, the emphasis has often been on renderings and animations. Although more difficult, there are no technological reasons that sound cannot be incorporated, and tactile feedback is possible -- taste and smell are also not beyond the reach of current researchers (USC 2004).
8. Conclusion
Many methods are available to show missing data, multiple reconstructions, and confidence levels. I have attempted to collect as many approaches and examples as I could and plan to continue developing the list and pursuing related lines of research. Along the way I have relearned two important lessons. As scholars, we need to provide a valid line of reasoning that goes with our assumptions, and we should never forget the magic in a good image or animation of a vanished civilization. Worth stressing to a generation of digitophiles, is the magic of seeing the real artifact and touching a piece of history whether it be the pyramids of Egypt or a shard of Mayan pottery.
-- Karen M. Kensek
University of Southern California, School of Architecture, Graduate Research Scholars program -- It provided the opportunity for students to spend some time with me researching this topic. Special thanks to Lynn Swartz for exploring this topic with me in one of her classes.
I would also like to acknowledge the thousands of scholars that are not directly credited in this paper. Every day people make decisions as to what to show, what not to show, and how to explain things more clearly to colleagues, students, and the general public. I could not possibly find every type of example, and I am certain that others have more experience than I with this topic. Thanks.
Copyright for the images are listed. Please contact copyright holders if you wish to use their images.
Figures, student work, University of Southern California, School of Architecture: 1a - Annie Shu (1998); 1b - Ofelia Fiallos (1998); 1c - Keith Ireland (1998); 2 - Min He (2003); 6a, 11, 38a - Patrick Mikusky (2005); 7b, 7d - Juan Chen (2005); 10b - Jungwook Jang; 15 - Juan Chen (edited by Karen Kensek) (2005); 18a - Sarah Heyenbruch and Jennifer Charleston (1997); 18b - Tami Nguyen (1998); 20a - Min He (digital) and Bekir Gurdil (2004); 21a - Anish Tripathi (2000); 24a - unknown student (with Karen Kensek); 24b - Elizabeth Valmont (2005); 25a - Tin Shan Mak (2000); 26, 27c, 35 - Pelin Herpilingirler (manipulated in Photoshop by Karen Kensek) (2002); 29b - Juan Chen (2004); 40a - Alisa Slesky (2004).
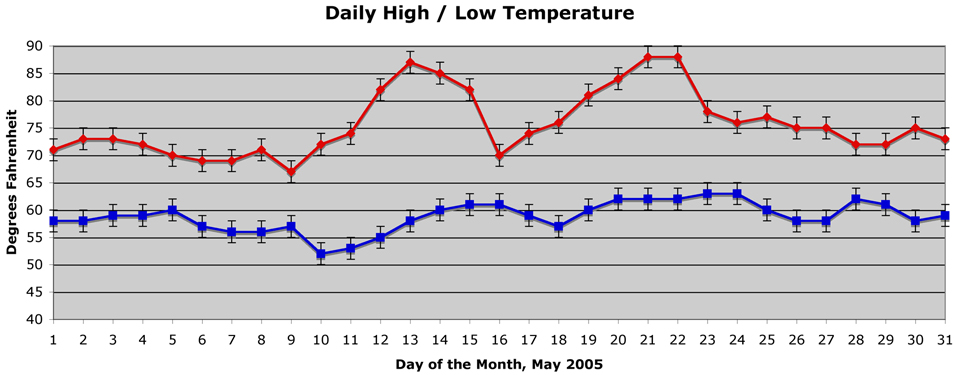
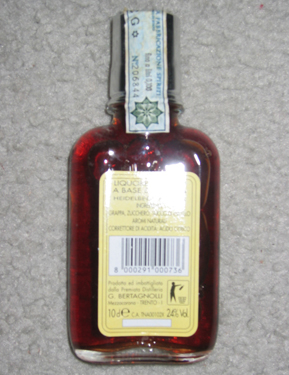
Figures, photographs and digital models by Karen Kensek: 3, 32b - St. Mary's City (2003); 4a, 4d, 8b - the Alamo and San Antonio mission sites (2005); 17a - Freeman House mold and 3D scan; 22 - digital model (2005); 23c - digital Web console (2002); 28a - digital model (2005); 28c: Photoshop diagram (2005); 31a, 32a - Aten portico digital model (2002); 34a - daily weather graph for May 2005 in Los Angeles, data from www.weather.com, error bars are fictitious; 34b - volt meter; 34c - liquor bottle; 36a - digital model of Turkish house; 37c - mockup of digital Web console (2002); 37d - Aten portico digital model using different rendering techniques (2002).
Figures 4b (LACM A.788562-12), 5a, 5b, 6b, 6c, 8c, 10a (LACM 7245/28471), 12b (LACM 65216 50926), 16a, 17c, 19 (heavily manipulated in Photoshop), 25b, 38b, 39b, 39c: Natural History Museum of Los Angeles County, photographs by Karen Kensek (2005).
Figure 4c, 16b, 17b: Page Museum, Natural History Museum of Los Angeles County, photographs by Karen Kensek (2005).
Figure 7a: X-ray crystal structure of rabbit N-acetylglucosaminyltransferase I: catalytic mechanism and a new protein superfamily, Ulu M. †nligil, et. al, Figure 7. Copyright (c) 2000 by the European Molecular Biology Organization, http://www.nature.com/emboj/journal/v19/n20/full/7593341a.html (Accessed 29 September 2005).
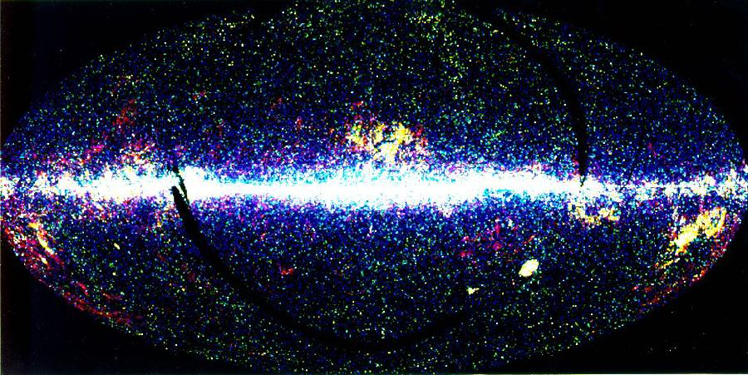
Figure 7c: Infrared Processing and Analysis Center, Caltech/JPL. IPAC is NASA's Infrared Astrophysics Data Center, http://coolcosmos.ipac.caltech.edu/image_galleries/IRAS/psc_allsky.html (Accessed 28 September 2005).
Figure 8a: "An effigy head from Blueberry," Artist's reconstruction of the effigy head by Scott Mitchell. Permission to use from Anne Reynolds, http://www.mofac.org/archaeology%202%20.htm (Accessed 29 September 2005).
Figure 9: Honeyman tablet. Photograph by Bruce Zuckerman and Marilyn Lundberg, West Semitic Research. Courtesy Department of Antiquities, Cyprus. Copyright reserved by owner. Permission to use 20 October 2005 by Bruce Zuckerman and Marilyn Lundberg.
Figure 12a: "Images Copyrighted by Historylink101.com & found at Egyptian Picture Gallery." http://historylink101.net/egypt_1/rf-k-egyptian-wall-painting.htm (Accessed 28 September 28 2005). Image enhanced in Photoshop by Karen Kensek.
Figure 13a: Dead sea scroll fragments. Photograph by Bruce and Kenneth Zuckerman. West Semitic Research. Courtesy Department of Antiquities, Jordan. Copyright reserved by owner. Permission to use 20 October 2005 by Bruce Zuckerman and Marilyn Lundberg.
Figure 13b, 21b: Ename Center for Public Archaeology and Heritage Presentation" permission from Neil Silberman http://www.ename974.org/Eng/pagina/archeo_internetTV.html (Accessed July 2005).
Figure 14: "Reproduced by permission of Immersion Corporation, Copyright (c) 2005 Immersion Corporation. All rights reserved," cybertouch_datasheet.pdf, http://www.immersion.com/3d/products/cyber_glove.php (Accessed 29 September 2005).
Figure 17d: Greaves & Thomas. Permission to use by James at tiscali.co.uk, http://myweb.tiscali.co.uk/greavesandthomas/globe_restoration.html (Accessed 5 October 2005).
Figure 20b: Copyright and permission to use by Florian Zimmermann, landscape architect, Berlin, Germany, www.lazim.de, http://www.lazim.de/english/Fischtal4_e.html (Accessed 25 September 2005).
Figure 20c: Pompeii: Monuments Past & Present, A. De Franciscis with updating by I. Bragantini, publisher Vision s.r.l. , Rome, www.visionpubl.com, distributed in the U.S.A. by J.P. Getty Foundation. Permission to use book cover granted by Stephen P. Schneider, Vision srl Director.
Figure 23a, 23b, 36b, 36c: Consoles prototyped in Flash by Nick Cipolla in 2002 and 2003. Cipolla, Nicholas; Swartz Dodd, Lynn; Kensek, Karen; and Pollini, John. Problematics of making ambiguity explicit in virtual reconstructions: a case study of the Mausoleum of Augustus, Archaeological Institute of America (AIA), AIA Annual Meeting, San Francisco, CA, January 2004.
Figure 26b: "Images reprinted courtesy of ArcNews and ESRI. Copyright (c) ESRI. All rights reserved. The original article appeared in the Spring 2004 issue of ArcNews and represents the work of the Grove School GIS Club under the guidance of Craig Lesh and Bob Booth," http://www.esri.com/news/arcnews/spring04articles/grove-high-school.html (Accessed 29 September 2005). For more information about ArcNews, visit www.esri.com/news/arcnews/arcnews.html .
Figures 26c, 26d: Jepson, Bill and Snyder, Lisa (et al.) (2002). UCLA Urban Simulations real-time navigable version of Temple Mount's reconstructed buildings done in collaboration with the Israel Antiquities Authority; thanks to Bill Jepson and Lisa Snyder for permission to use the images, http://www.sgi.com/industries/sciences/museums/features/iaa_story.html and http://www.ust.ucla.edu/ustweb/Projects/israel.htm (Accessed April 10, 2005). See endnote under UCLA for other information.
Figure 27a: http://www.gallup.com/poll/content/default.aspx?ci=16915 (Accessed June 21, 2005).
Figure 27b, 30b, 34c, 34d: National Oceanic & Atmospheric Administration (NOAA), U.S. Department of Commerce, http://www.erh.noaa.gov/er/lwx/digital/VA56afm.htm , http://www.hpc.ncep.noaa.gov/nationalfloodoutlook/ , http://www.cpc.ncep.noaa.gov:80/pacdir/NFORdir/FIG1Tdir/93.1.t.html , http://www.noaanews.noaa.gov/stories2004/s2290.htm (All accessed 28 September 2005).
Figure 28c: Copyright Dr. Wendy L. Keeney-Kennicutt. Some cut and paste rearrangement in Photoshop by Karen Kensek, http://www.chem.tamu.edu/class/fyp/mathrev/mr-sigfg.html (Accessed 28 September 2005).
Figure 29a, 34e: Johnson, Chris R. and Sanderson, Allen R.. Scientific Computing and Imaging Institute, University of Utah; Visualization Viewpoints, A Next Step: Visualizing Errors and Uncertainty, September / October 2003. Published by the IEEE Computer Society. Permission and images by Alex Pang (Figure 2 is the wind direction illustration).
Figure 30a: copyright and permission to use by John Koonz, geobox.com, http://www.geoblox.com/socialstudies.htm (Accessed September 29, 2005).
Figure 31b: Strothotte, Thomas; Masuch, Maic; and Isenberg, Tobias (1999), Visualizing knowledge about virtual reconstructions of ancient architecture, Computer Graphics International 1999 (CGI'99), p. 36. Figures 4 and 6. Used by permission of Thomas Strohotte.
Figure 33a: Heroic fights and dying heroes - tThe Orlat battle plaque and the roots of Sogdian art by Markus Mode. Published 2003. Figure 4a. Use by permission of Markus Mode, http://www.transoxiana.org/Eran/Articles/mode.html (Accessed September 2005).
Figure 33b: Copyright and permission to use images by David Manthey, orbitals.com, http://orbitals.com/orb/ov.htm , ov.pdf, page 6, figure 3 (Accessed 21 June 2005).
Figure 37a, 37b: Djurcilov, Suzana, Kim, Kwansik, Lermusiaux, and Pang, Alex, Volume rendering data with uncertainty information, Computers and Graphics, Volume 1047, 2001. Interesting paper that describe techniques for making the regions on high and low uncertainty easier for the viewer to distinguish. Figures 6 and 7 by Suzana Djurcilov, figure 11 by Kwansik Kim, used with permission of Suzana Djurcilov.
Figure 39a: Photograph by Garry Fletcher, Victoria, BC Canada; used with his permission, http://www.racerocks.com/pearson/cw/whale/graywhal.htm#lost (Accessed 29 September 29, 2005).
Figure 40b: M. Carmen Locci, Understanding an ancient Roman city in Tunisia, ,Arcuser online, Fall 2003, http://www.esri.com/news/arcuser/1003/romanruins.html (Accessed 29 visited September 2005). Used with permission of Maria Carmen Locci.
Figure 40c: Eiteljorg, Harrison, II. Linking text and data to CAD Models. CSA Newsletter. Vol. XIV, No. 3, Winter 2002 issue. http://www.csanet.org/newsletter/winter02/nlw0201.html (Accessed 23 April 2005). Used with permission of Harrison Eiteljorg, II.
American Museum of Natural History (AMNH). This is one of many locations that mentions the wrong head originally being ascribed to the Brontosaurus (now called Apatosaurus). http://www.amnh.org/exhibitions/permanent/fossilhalls/virtualtours/ or see the reconstructions in WikiBooks http://en.wikibooks.org/wiki/Wikijunior_Dinosaurs/Brontosaurus. (Accessed January 29, 2007)
Eiteljorg, Harrison, II 1998. Photorealistic visualizations may be too good. CSA Newsletter, XI, 2; Fall, 1998. http://www.csanet.org/newsletter/fall98/nlf9804.html (Accessed 14 December 2006). This article cogently summarizes similar arguments about the positive and negative aspects of computer renderings.
Eiteljorg, Harrison, II 2002. Virtual reality systems - what can they contribute to archaeology? CSA Newsletter, XV, 1; Spring, 2002. http://www.csanet.org/newsletter/spring02/nls0205.html (Accessed 14 December 2006). This article emphasizes the importance of evidence versus interpretation in VR representations and reminds the reader that what might be most important is to encourage the audience (professionals or the general public) "to ask their own questions and to look carefully at the evidence as they try to answer those questions."
Eiteljorg, Harrison, II 2002. Linking text and data to CAD Models. CSA Newsletter, XIV, 3; Winter, 2002. http://www.csanet.org/newsletter/winter02/nlw0201.html (Accessed 23 April 2005). This article shows how links can be made between AutoCAD and FileMaker for an architecture reconstruction.
Ename 2005. Ename Center for Public Archaeology and Heritage Presentation. http://www.ename974.org/Eng/pagina/archeo_concept.html (TimeScope images). http://www.ename974.org/Eng/pagina/archeo_internetTV.html (QuickTime VR images) (Accessed July 2005) Images are used by permission of Neil Silberman, Director.
"The TimeScope 1 system consists of a video camera, a computer system, two monitors, and a touch screen . . . By using real-time images of the archaeological remains as a background for the reconstructions and multimedia presentations, the TimeScope 1 system offers visitors a sense of immediacy and realism in which the actual weather, sky conditions, and angle of sunlight at the time of their visit serve as a background for the virtual reconstructions." For a description of other interesting projects that Ename is working on, check their websites at http://www.ename974.org/Eng/pagina/index.html and http://enamecenter.org/pages/about_us .
Extreme Guides 2005. Expressing various levels of certainty in Japanese. http://www.extreme-guides.com/sup/7/46/ (Accessed 7 February 2005).
Forte, M. and Siliotti, A. (eds) 1996 English edition. Virtual Archaeology: Re-creating Ancient Worlds. New York, Harry N. Abrams, Inc. See page 206 for example of GIS. For a good overview, Introduction pp. 8-13. This excellent resource covers a vast number of virtual reconstructions ranging from rock art to ancient cities, buildings, and even people.
Historic St. Mary's City in Maryland 2003. http://www.stmaryscity.org/VirtualExhbit/lnadscp.htm (Accessed 2003). Although one can find some information at this site, the photographs and observations were made by the author during her visit of the site during the summer of 2003. Of note at Historic St. Mary's City is that they use many different techniques for showing reconstructions: make actual remains accessible, reconstructing on top of the foundations (that are left buried), "ghost outlines" of buildings (timber frames outlining the edges full size of places they thought buildings existed), and full size architectural reconstructions of buildings and gardens.
J. Paul Getty Trust Publications 2000: Staccioli, R.A., Ancient Rome: Monuments Past and Present; De Franciscis A., Pompeii: Monuments Past and Present; Behor, G., Ancient Greece: The Famous Monuments Past and Present; spiral editions. January 1, 2000. I found these especially useful in my travels and saw other international travelers carrying comparable books.
Johnson, Chris R. and Sanderson, Allen R. 2003. Scientific Computing and Imaging Institute, University of Utah. "A next step: visualizing errors and uncertainty." Visualization Viewpoints. September / October 2003. Published by the IEEE Computer Society. Non-architectural examples, several using displacement glyphs as a type of error bar. Miller, Paul and Richards, Julian, 1995. "The good, the bad, and the downright misleading: archaeological adoption of computer visualization." CAA, 1994 (BAR International Series 600, 1995, editors Jeremy Huggett and Nick Ryan). Recommended to the author by Harrison Eiteljorg, II. A much earlier article on a similar subject concluding with the caveat, "In conclusion, we believe that computer graphics should carry a health warning. The motive for employing graphical modeling and imaging systems in the entertainment and advertising industries is the creation of pictures that elicit certain kinds of responses from the viewer, such as awe and wonder. Their role is to manipulate the audience."
Novitski, B. J. 1998. Rendering Real and Imagined Buildings. Rockport Publishers, Inc. Pages 34 - 39 deal with the village of Ceren. Categories of rendering include reconstructing lost buildings, visualizing unbuilt designs of famous architects, imagining new designs, and virtual environments.
Phelps, Nigel 2004. "The reality is, Troy was quite a bit smaller than what we eventually designed - it's really quite contained," says the designer. "But you did have an outer wall and you did have an inner palace within the confines of the town. For the most part, all of the houses were single story and flat-roofed and made of mud. So we had to expand on that a little to make it more visually interesting." Production designer, "Troy" (the movie, directed by Wolfgang Petersen). http://www.cinemareview.com/production.asp?prodid=2519 (Accessed 5 April 2005).
Phillips, Kathleen (2002). "Texas scientists reach out and touch molecules." /cite>AgNews. Article about Dr. Edgar Meyer's research at Texas A&M University, http://agnews.tamu.edu/dailynews/stories/BICH/Jul1602a.htm (Accessed 18 October 2005).
Serrato-Combe, Antonio 2001. Aztec Templo Mayor: A Visualization. University of Utah Press. (see images on pages 8, 94, and 95) . This book is an excellent example of methods and techniques for creating a computer model. It discusses sources of data, reliability of information, the use of existing material, and the development of the computer model in a detailed and interesting way.
Shneiderman, Ben and Pang, Alex 2005. PowerPoint presentation on Visualizing uncertainty: computer science perspective. National Academy of Sciences Workshop, March 3-4, Washington DC. I read the article on-line at http://www7.nationalacademies.org/bms/visualization_title_page.html (Accessed 17 June 2005). I saw the idea of the polling statistical uncertainty from this paper. This paper also has many similar concepts to this one from a scientific visualization viewpoint.
Sideris, Athanasios, Roussou, Maria, and Gaitatzis, Roussou 2004. "The virtual reconstruction of the Hellenistic Asclepieion of Messene." IMEROS, an Annual Journal for Culture and Technology published by the Foundation of the Hellenic World, Issue 4, 2004. Abstract only. Unable to get copy of complete paper. http://www1.fhw.gr/publications/print/imeros/en/04/index.html (Accessed 12 October 2005).
Snyder, Alison and Paley, Samuel 2001. "Experiencing an ancient Assyrian palace: methods for a reconstruction. Reinventing the Discourse." Proceedings of the Twenty First Annual Conference of the ACADIA, Buffalo, NY; ed. W. Jabi, pages 90-99. For more information on the current status of the project, visit http://www.learningsites.com/NWPalace/NWPalhome.html .
Strothotte, Thomas; Masuch, Maic; and Isenberg, Tobias 1999. "Visualizing knowledge about virtual reconstructions of ancient architecture," Computer Graphics International 1999 (CGI'99), p. 36. A paper on a similar topic with a good case study example for the Palace of Otto the Great.
Troy. For a more complete look on current scholarly work being done at Troy, please see Project Troia: Troia and the Troad - Archaeology of a Region, being undertaken by the Institut für Ur- und Frühgeschichte und Archëologie des Mittelalters at the University of Tübingen and the Department of Classics at the University of Cincinnati, http://www.uni-tuebingen.de/troia/eng/ (Accessed 4 January 2007).
UCLA. In addition to the Temple of Jerusalem project cited (Figures 26c, 26d), much other work is being done including Rome Reborn and the Forum of Trajan. Visit the Urban Simulations web site at http://www.ust.ucla.edu/ustweb/projects.html. (Accessed 4 January 2007).
USC 2004. Visited two research labs at the University of Southern California. Both labs are doing other work not discussed here. The Institute for Creative Technologies (www.ict.usc.edu) demonstrated multi-sensory platforms for designing military training systems. The Integrated Media Systems Center (www.imsc.usc.edu) exhibited immersive three dimensional sound environments.
For other Newsletter articles concerning the use of electronic media in the humanities, consult the Subject index.
Next Article: Image Repositories: Works in Progress
Table of Contents for the Winter, 2007 issue of the CSA Newsletter (Vol. XIX, no. 3)
 Table of Contents for all CSA Newsletter issues on the Web
| CSA Home Page |