
|
Harrison Eiteljorg, II
 |
 |
 |
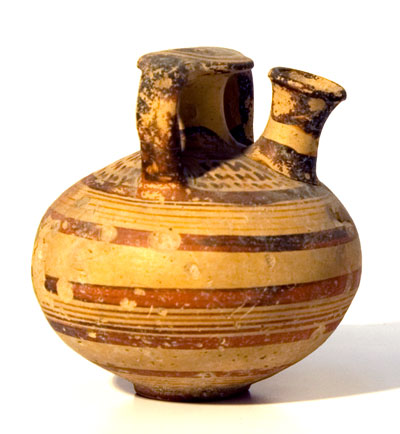
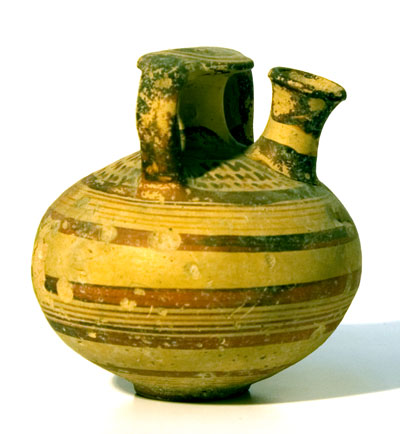
Figure 1 -Three versions of the same digital photograph of a Mycenaean pot.
When an archaeologist takes a photograph of an object or a portion of an excavation where scale issues are relevant, he or she can generally be counted on to include a scale. Including a scale -- whether a carefully manufactured one or something simpler and less expensive -- is simply taken for granted. Without a scale, neither an object nor a trench is well photographed. To be sure, the scale is often placed so that it can be cropped out for a published version of the photograph, as it has been in the images above, but the use of the scale is assumed.
When color photographs were taken only for slide presentations, there seemed to be no need to worry about faithful color reproduction as well as scale. Color images, after all, were not intended for publication; costs prohibited using them in scholarly works. A photograph to be shown only on a screen in a darkened room seemed hardly to require a color chart -- and the time required to take care with the photographic process.
The web has changed the use of color, presumably forever. Cost is not an issue with color images on the web. A color image costs more only to the extent that disk space is more expensive because of the larger files. As a result, color images are now the norm on the web; what we used to call black & white photographs but must now call gray-scale images are used only when the original source is an old black & white photograph or a published image that has been copied.
The web may now be full of color images such as the ones above, but the procedures for making color images of archaeological materials have not changed. We still have scales, but we have not added color charts to our color photographs. Since color charts have been available for years, there is no excuse for this; we have been asleep at the proverbial switch. Look again now at the three images of the Mycenaean pot. Note that they are different as to color cast. Which one is "right"? What does "right" mean in this context? While it may be quite possible to choose the image that most nearly represents the correct colors, would the others be seen as off-color if they stood alone?
It is time to update standard photographic practices for the discipline. A color chart, as well as a scale, should be included in all photographs for which correct color matters. Images like the one in Figure 2, the same pot but with a scale and a color chart, should be the standard for archaeology. Only in a view of a site or a landscape photo will a color chart be of no use (and it would be impossible to crop it out). It may be simplest to say that, if a scale is needed, a color chart is needed.
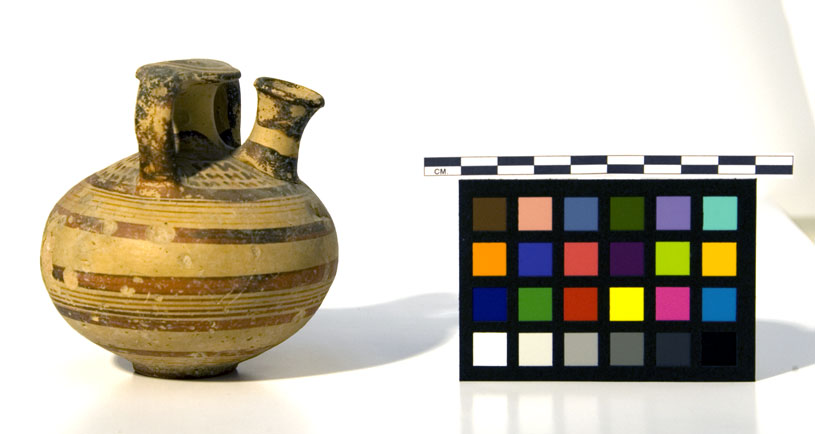
Figure 2 - The pot as actually photographed, with color chart and scale. (And with too much of the more distant background on the right.)
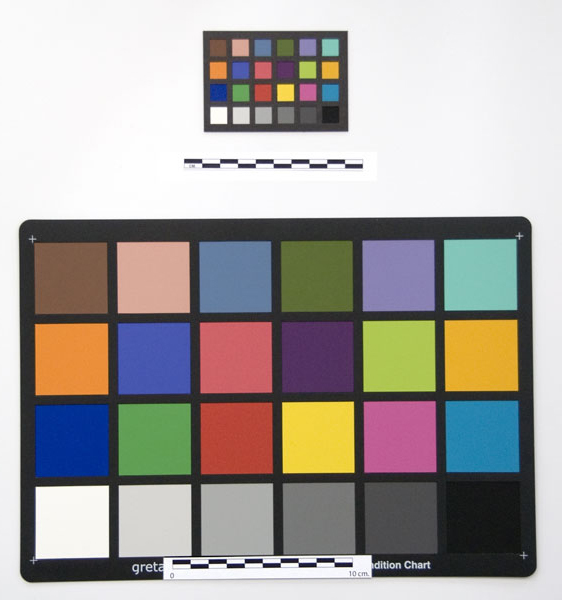
Figure 3 - Two GretagMacbeth color charts, a larger one (8 1/2 x 11 in.) that might be used in a trench photo,
and a smaller one (2 1/2 x 3 1/2 in.) appropriate for object photographs, as above. GretagMacbeth is the
manufacturer of the color charts that have become the standard. They also make other products for color calibration
It should be clear that cropping out the color chart -- or the scale -- is something one might do for some publications BUT NOT for for images to be used on the web by scholars. The color chart is required there, because, if colors are to be seen, they are only useful to scholars to the extent that they can be seen accurately. It is on the web that scholars must be able to make careful determinations about color for comparison purposes.
Lest there be some misunderstanding, I should be clear about what the color chart can do. The chart itself does nothing, nothing at all. It does, however, permit the users of images with the color charts to do several things. At the simplest level, the presence of the color chart provides for every user a fixed standard of comparison, a way to compare the colors of all the objects in the image with other objects in other images -- assuming they, too, include a color chart. Absent a chart, any comment about color based on an image on the web cannot be taken seriously. At the other extreme, a color chart can be used to calibrate a computer monitor, with appropriate equipment and software, so that the colors seen are accurate. Of course, seeing them accurately presumes that they have been represented accurately, and that is precisely why the color chart belongs in the image -- so that the accuracy of color reproduction can be judged independently.
The color chart makes it possible to judge the colors -- either by adjusting the monitor or by copying an image into a photo editing program and manipulating the image until the colors in the chart reproduce the original colors faithfully. (One of the images in Figure 1 matches the coloration of the image with the color chart. Can you tell which one?) For the pot illustrated above, one might consider the use of Munsel color numbers instead of the color chart. However, the precision of the Munsel colors could apply only to those portions of the pot/image fully defined (and the image would need added arrows or circles to show exactly which part of the pot had been defined).
One last point should be made. According to Wikipedia (http://en.wikipedia.org/wiki/Color_blindness; accessed 01/26/07), one common form of color vision deficiency affects 5% of all males. Other problems with color perception are less common, but more than one other form of color vision deficiency affects 1% of all males. Given this common problem (one I share, being relatively insensitive to yellow/green), taking care with color photography and reproduction is even more important than might have been assumed; the better the reproduction system, the less likely that misperception will occur.
-- Harrison Eiteljorg, II
For other Newsletter articles concerning the use of electronic media in the humanities, consult the Subject index.
Next Article: AutoCAD® 2007 Reviewed
Table of Contents for the Winter, 2007 issue of the CSA Newsletter (Vol. XIX, no. 3)
 Table of Contents for all CSA Newsletter issues on the Web
| CSA Home Page |