
|
The Geographic Information System (GIS) for the Historic District of Annapolis was begun in 1996 under the direction of Dr. Mark P. Leone and Dr. John L. Seidel, of the University of Maryland, College Park. The project was funded by two consecutive grants (1996, 1997) from the Maryland Historical Trust. Leone and Seidel, along with project staff, worked closely with City of Annapolis Planning and Zoning, and the Historic Annapolis Foundation to create a system which best suited the district's needs.
Historic Annapolis presents a distinct challenge to the preservationists and planners who research and manage the city. The city is a carefully balanced mix of past and present. It contains three overlapping historic districts (four if counting the Naval Academy) over 86 archaeological sites, a plethora of historic buildings of both National Register and local significance, and a historic past which dates back to the 17th century. Added to this mix is Annapolis' bustling business and tourist trade, as well as its status as the legislative seat of Maryland.
Planners and preservationists are presented with problems every day concerning the delicate balance of the present and past. The development of a GIS devoted to the purpose of integrating historic and current information was expected to help solve crucial problems for the city. The ability of the user to see both aspects of the city would allow for more efficient and informed decision making.
With that in mind, the GIS was designed with four goals:
The GIS system accomplishes this by creating a data warehouse that integrates and displays information in an easy-to- use map format. More than 70 types of information, including but not limited to archaeological and National Register sites, historic maps, easements, historic photographs, architectural surveys, census data, and current structures have been built into the system. The usefulness of the system has been recognized by city planners, preservationists, archaeologists, and archivists as a way to gather, store, and display information.
The system is run on an IBM® PC, Windows-based computer system, and is conceived with user friendliness in mind. Arc/Info® and ArcView®, two of the most widely used GIS software packages available, were the software packages used. The software is extremely flexible, allowing the use of most major types of databases (such as dBASE® and Paradox®) and digital drawings (such as AutoCAD, or USGS quad maps), thus allowing you to use data which may already be available.
Creating a GIS was chosen over the use of a set of linked CAD databases for several reasons. First, the use of a GIS allowed us a great deal of flexibility in the overall look and feel of the system. Almost every aspect of the software could be programmed or changed through Avenue; ArcView's programming language. The GIS also allowed the use of a wide variety of resources, including text, photographs, scanned art, and, had we wished, sound and video. Finally, the use of a GIS with in-depth spatial analysis capabilities opened up the possibility of using the system as a research tool in the understanding of the city's growth and population shifts.
At the heart of the system is a series of maps detailing the status of the city in current and historic conditions. Maps that detail the location of National Register sites, historic districts, archaeological site locations, current properties, and historic conditions are overlaid on top of each other so that all the different facets of the district can be viewed together as the user chooses.
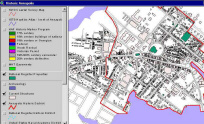 Fig. 1 - Main map, the Historic
District of Annapolis. (Note that the map and the other views of the GIS system are
raster images that appear more crude on paper than they do on a computer monitor. This
image has been cropped to eliminate software buttons and menus.)
Fig. 1 - Main map, the Historic
District of Annapolis. (Note that the map and the other views of the GIS system are
raster images that appear more crude on paper than they do on a computer monitor. This
image has been cropped to eliminate software buttons and menus.) Information from maps such as these are used daily by planners and preservationists to handle zoning decisions, archaeological sensitivity, and the protection of historic resources. Most maps were digitized from hard copy maps from a variety of sources: Planning and Zoning, Maryland Archives, Historic Annapolis Foundation, and others. Some, like the current properties map (detailing the location of over 1500 properties in the district) were donated to the project already digitized.
All maps are referenced to the same basic map. Placing one map atop another allows for greater depths of information to be displayed on the screen. By overlaying the archaeological sites map over the current structures map, for instance, one can relate the positions and density of archaeological sites to the city. Using this type of overlay, the user can measure distances and other relationships between features on different maps. For example, one can query the system to show all buildings which are within 10 meters of an archaeological site in the district.
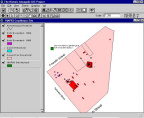 Fig. 2 - The Courthouse archaeological site
in Annapolis, with individual excavations shown. (The image is
taken from the screen, but it has been cropped to eliminate software buttons and menus.)
Fig. 2 - The Courthouse archaeological site
in Annapolis, with individual excavations shown. (The image is
taken from the screen, but it has been cropped to eliminate software buttons and menus.)
The maps are then linked to databases which contain textual and database information about the features depicted in the maps. For example, buildings which are National Register sites have their complete records from the National Register database linked to their locations on the map. This allows the user to query the map for specific features or particular aspects of those features. This, in turn, allows the user to single out features based upon a series of criteria as well as their general classification. The GIS can also work with several types of data at once, tracking the relationships of features across maps of separate data types.
The system can be used to create a catalogue of information in an easy to understand format. For example a map containing information specific to Main Street could be used to examine the possibilities of developmental impact upon this particular area of this city. The view could include census information, information on historic architecture, archaeological information, historic and current photographs, and building and street location. Using this information, one could create maps which pinpoint areas to be most impacted by development, areas which would benefit from development, and those which need the most protection. The system has been used on several occasions to help indicate the possibility of archaeological sensitivity during the permit review process for buildings within the district, by examining data already in the GIS, coupled with overlays of historic maps. Gathering this type of information might require extensive research manually and might be difficult in situations that require quick action and decision making. This use holds special promise when there is not enough time to do the extensive historical research normally warranted in an impact statement.
The GIS system for Annapolis contains several types of information, and will continue to grow to meet the needs of the users. The long-term goal is to create a system that helps manage and protect the historic resources of the district, while at the same time providing an innovative way to research and examine the makeup of the city itself. The information currently in the system can be broken into these broad categories: Current, Archaeological, Architectural, and Historical.
The system contains several levels of information on current district status. Included in the system are addresses for every parcel and building in the district, along with deed information, owner's information, and type of land use. Each structure in the district is represented and can be queried by address. Using the query tool, the user can single out buildings using a number of criteria. The current conditions map is the base map for this system and contains a great deal of information for managing the district.
The system contains archaeological information and locations for all known sites (both prehistoric and historic) in the Historic District. This information was culled from Maryland Historical Trust site survey files. Included here are data for each site including geographic information (excluding, of course, exact coordinates for prehistoric sites), as well as owner (if any), known investigations (along with citation), collection locations, and information on excavations.
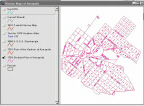 Fig. 3 - A view of the GIS
computer screen showing the 1783 Stoddart Plan of Annapolis. (Cropped to eliminate
software buttons and menus.)
Fig. 3 - A view of the GIS
computer screen showing the 1783 Stoddart Plan of Annapolis. (Cropped to eliminate
software buttons and menus.)We are also continuing to seek out and digitize historic maps of the city. Maps such as the 1783 Stoddart Plan (Fig. 3) can be extremely useful in terms of visualizing the city at various times, but also for overlay. By overlaying them with current or other maps of the city, the differences help make clear the changes Annapolis has undergone over time.
Historic architectural information is very important in Annapolis. Because of this we have incorporated architectural surveys done for selected streets in Annapolis. These surveys are important sources of information concerning chains of title, building dates, building uses, and the architectural evolution of the city. Each building surveyed is linked to a capsule summary of the building that gathers the important information for each building into one text file. Additionally, a photo of the current building is included as well, es sentially a mouse click away. Maps created here can be used to create guides for the area or to help to keep track of building changes within the historic district. To have this sort of information integrated into one outlet can aid in planning and management decisions.
Along with historic architectural and archaeological information, the system contains a large and growing amount historical data. These data include census information, historic maps, and historic photographs.
Historic photographs, gathered from the Maryland Archives and the Historic Annapolis Foundation, have been scanned and integrated into the system. They are anchored to the map by click points. In the legend, each photo is described and dated. When clicked on, the photograph appears in its own separate window. The photo can be moved and, most importantly, the quality of the scans allows the user to zoom in on specific aspects of the photo. There are currently nearly 100 historic photographs in the system, ranging in date from 1859 to the early 1920s. The use of these photographs in association with architectural surveys and archaeological information are powerful tools for preservation management and code enforcement.
The Annapolis GIS system can be used to track and analyze the changes in the city over time, the spread of particular practices or behaviors, the development and dissolution of neighborhoods over time, the movement of the economic base, changes in development, and the interaction (or non-interaction) of different groups with the city. For example, by digitizing a variety of Sanborn Fire Insurance maps (which detail every building in the city) from several periods and then attaching census or other historical information to these maps, one can examine the impact of a neighborhood as it grows and changes over time. A neighborhood in Annapolis can be tracked as it changes from a large lot with a lonely building in the 18th century, to a full scale neighborhood in the late 19th century, complete with businesses and residential structures, until it slowly becomes taken over by the expansion in the 20th century. Using this type of analysis, any change can be tracked over time.
While the use of a GIS is not an end in itself or a cure-all, it can be an effective tool for the management, integration, and analysis of information. It is an essential tool when trying to collect, relate, and interpret the varied and sometimes overwhelming quantity of data that can be important for a given area of study.
John J. Buckler
GIS Coordinator
Department of Anthropology, University of Maryland
For other Newsletter articles concerning the applications of GIS in archaeology and architectural history, or the use of electronic media in the humanities, consult the Subject index.
Next Article: The Lerna Database Experiment
Table of Contents for the Winter, 1998 issue of the CSA Newsletter (Vol. X, no. 3)
 Table of Contents for all CSA Newsletter issues on the Web