 |
Pottery has normally been drawn through conventional and traditional methods; seldom has any new device or method been introduced for the purpose. However, the optical plotter called a Reflex Metrograph (RM), designed by Scott (1981) as a photogrammetric device for 3D measurement of dental casts, has found its use in archaeological drawings also (Scott, 1982). In view of its utility for pottery drawing we procured the equipment from the UK for the same purpose and demonstrated its utility in making drawings quickly and accurately as compared to manual drawings (Nautiyal et al., 1995).
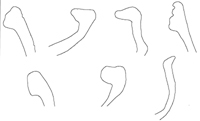
 Fig. 1 - Profiles drawn with the Reflex Metrograph device.
During the last four years, the technique of optical plotting has been further modified and improved upon by using AutoCAD Release 13 for generating 2D and 3D graphics of pottery. Before discussing the AutoCAD addition we shall highlight the details of the RM system.
The RM comprises an object table, a semi-reflecting mirror, a mirror mount, and a light source moveable on an X, Y, Z slide system. Measurement of a feature on the pottery is made by aligning a point of the object with a light spot (0.3 mm in diameter) made on the object by the machine, using both an image reflected by the semi-reflecting mirror and one passing through that mirror. A precise 3-dimensional matching of the point and the light spot can be made using binocular vision. On one end of the sliding system there is a provision for a pencil holder with a specially designed pencil that can be used directly for drawing the shape of an archaeological object on the drawing table. The slide is also electronically calibrated so that it can send the exact position of the light source (x-, y-, and z-coordinates) to a computer. Thus, the advanced software versions and standard interface allow speedy 3D digitization and graphical reproduction of the objects (Scott, 1982).
Rplot2 is a digital map data capture system for use with photogrammetric plotters. It is fitted with RM to record the changes in X-, Y-, and Z-coordinates. Rplot2 can run on any IBM compatible system.
Model coordinates are transformed to ground coordinates and the data is displayed in a full-color graphical environment. Though RM was used by Scott (1982) for archaeological drawing as indicated above, its utility was restricted to producing only the outlines of the object. The subsequent addition of the Rplot2 software to the system has allowed us to convert the RPT file into DXF format for use with AutoCAD.
Though RM has been designed to trace the section and the plan of the objects optically and to digitize them in X-, Y-, and Z-coordinates, the following limitations for generating archaeological drawings have been found.
The utility of computer graphics by using CAD products for drawing, mapping, and 3-dimensional reconstruction in archaeological research has been recognized by various workers (for example, Schiffer, 1982); however, recently programs like PhotoShop® and some CAD based software like Draftsman® have been used quite successfully for manipulating images, producing archaeological line drawings, and saving the drawings for further modification (Menten, 1996; Eiteljorg, 1997 and 1998). Recently the application of AutoCAD Release 13-14 has been found to be more useful in tracing drawings from scanned images because of its better curve drawing algorithm, called NURBS (Eiteljorg, 1997). So far as Indian archaeology is concerned, no work has been attempted in this direction. Therefore, for the first time we have exploited the versatility of AutoCAD for archaeological pottery drawings in India, and it has proved to be very helpful to use AutoCAD on optically generated DXF files for regenerating 3D rendered images of pottery.
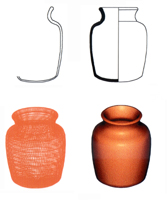
 Fig. 2 - The full modeling process - the profile, the profile mirrored and filled,
the full pot surfaced, and the pot rendered.
Stage 1
A pottery fragment or a full pot is placed before the semi-reflecting mirror of the RM and the light source
is moved in X-, Y-, and Z-axes over the object to generate the data. The data is stored as RPT files that can
create the Section (XY axis) and Plan (XZ axis).
Stage 2
RPT files are converted into DXF (drawing exchange format) through software version 2.2 (Rplot2). They are
then imported into AutoCAD, and the appropriate commands in AutoCAD are used to find the diameter, mirror
the profile to make the drawing of the opposite side of the pot, revolve the profile around its axis to make a
complete pot, render the full pot, and so on.
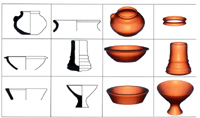
 Fig. 3 - Vase drawings with accompanying renderings. First and third columns,
second and fourth show drawings and renderings of the same pot. Note that renderings are from differing angles.
The manipulation and modification of DXF files through AutoCAD Release 13-14 has been successful for generating 2D and 3D graphics and even the rendered images of pottery. The use of AutoCAD has enabled us to establish another computerized technique of pottery drawing in archaeology. This technique needs further development in order to capture the full colour and shade of the fabric of the pottery so as to develop virtual images. The work in this direction is in progress.
Acknowledgements:
The authors are grateful to University Grants Commission (UGC) and All India Council for Technical Education
(AICTE), New Delhi, India, for providing financial support to establish the computer facilities in the department
under the SAP and R&D programs. We would also wish to thanks to Sri J. S. Negi, draftsman who was involved with
this work in the initial stages. We are grateful to Prof. B. M. Khanduri, head of the department for providing us
the facilities under the SAP programme.
References:
-- Vinod Nautiyal
Sudhir Nautiyal
Mohan Naithani
HN Garhwal University
Srinagar Garhwal 246174
India
To send comments or questions to any of the authors, please see our email contacts page.
For other Newsletter articles concerning pottery profiles and capacity calculations, the applications of CAD modeling in archaeology, or uses of electronic media in the humanities and capacity calculations,consult the Subject index.
Next Article: CAD Data Segmentation - A Crucial Tool
Table of Contents for the Winter, 2000 issue of the CSA Newsletter (Vol. XII, no. 3)
 Table of Contents for all CSA Newsletter issues on the Web