
|
To prepare for more survey work on the Propylaea, CSA personnel have been experimenting with a close-range or desktop photogrammetry program. Photogrammetry software permits survey data to be extracted from photographs, assuming that there are some known points or point-to-point dimensions for scaling within the photographs and that the important parameters of the camera/lens combination have been determined and used in the calculations. (For more information on photogrammetry, see the International Society for Photogrammetry and Remote Sensing electronic publication, Architectural Photogrammetry: Basic theory, Procedures, Tools, by Klaus Hanke and Pierre Grussenmeyer: http://www.isprs.org/commission5/tutorial/gruss/tut_gruss.pdf.)
Photogrammetry software may use either digital photographs, digitized images from film originals or enlargements, or standard enlargements (via a digitizing tablet).1 The program tested by CSA, PhotoModeler, is designed to use digital photos or digitized photos;2 CSA's intent is to use digital images directly, not digitized images from film-based photography.
The latest version of PhotoModeler (5.0) has just been released, and testing began with a CSA experiment on a simple, flat wall. Although the program is capable of doing 3D photogrammetry, this first experiment involved the simpler problem of locating points on a defined plane, not points located anywhere in three-dimensional space. Of course, no wall is truly flat; so there is no single plane on which all the points lie. Some minimal error is therefore to be expected in such a process, with the magnitude of the error depending on the flatness of the wall in question. In this case, the individual points were as much as .0019 m. above the plane chosen and as much as .0059 m. below that plane (according to total station survey data).
Before using PhotoModeler or any photogrammetry program to do surveying, one must determine the characteristics of the camera-and-lens combination employed via a process called calibration, and PhotoModeler supplies a set of procedures to accomplish that.3 The calibration process was not onerous, and there is a "Wizard," in the computer-speak of the day, to guide the user through the process.
The calibration process requires one to take several photographs (from various angles) of either a projected slide image or a printed version of the same image. The work was made much easier by having access to a Bryn Mawr College lecture room with a large slide screen and a good projector. Having such a large space was valuable because the projected image to be photographed should approximate the size of the area one expects to photograph for survey work. Although the projectors were good and the room ample in size, it was only possible to obtain a projected image less than one-third the size of the areas likely to be surveyed in Athens. (It should be noted that the requirements to avoid misshapen images -- images that are larger at the top or bottom or larger at one side than the other -- make a large room necessary. It is also important to have ways at hand to determine if the image has been properly projected. The process would seem better if the supplied 35 mm. slide had been provided on glass rather than film, but the manufacturer indicates that any distortion caused by the use of film has been taken into account.) For those wanting to print the image to be photographed instead of projecting the slide, there is a file provided on the program CD in PDF format. That file can be printed at virtually any size, though larger sizes are rather expensive, but there should be no need to worry about the shape of the printed version of the image.)
Since CSA personnel understood the effect of focusing on the actual focal length of a lens (focusing on objects closer than infinity increases the lens focal length progressively so that at closest possible focus the lens has its longest actual focal length), the images were taken with the lens set at a focus point that could be used for any photo intended for use with PhotoModeler. Care was also taken to be sure that setting the lens at that focus point could be repeated so the focal length would always be the same when the lens is used for photogrammetry work.
The calibration seemed to produce excellent results. The lens focal length (focused short of infinity, making its true focal length somewhat longer than the specified 28 mm.) was calculated to be 28.3198 mm., and the size of the image was very close to the manufacturer's advertised image size. The program also determined some lens distortion figures, calculating the lens center, spherical aberration, and decentering. Unfortunately, once complete, the calibration Wizard seemed to suggest that the calibration be run again. The Wizard window remaining had the "Execute Calibration" button marked for selection, and the only other choices were "Close" and "Help." The program crashed when there was an attempt to save the project at that point. (It crashed without quitting, making it necessary to shut the computer down to terminate the program. That has happened on other occasions since.) When the program was re-started, there was no evidence of the camera calibration to be found. Since this version of the program is 5.0, such misbehavior will probably be corrected soon. In fact, updates are already available on the Web; the updates are automatically searched out and added to the software on a regular basis.
The calibration process was done again. The results of the first process had been noted, and the second effort produced identical results, but a third pass, making the Wizard choice "Execute Calibration" this time, produced the results shown above, which were slightly different. There was still no apparent way to save the camera calibration. A routine for saving the calibration was finally found, and the calibration for the camera was saved. (Having saved the calibration, one begins a new project by entering various parameters, including the calibration file to be used. However, PhotoModeler has been designed to search for program files, not calibration files, a minor annoyance requiring an extra step in the process of starting a new project.)
This may be the proper place to point out the presence of a tutorial that would have helped with this process. CSA Director Harrison Eiteljorg, II, who was the primary person conducting the experiment, does not use tutorials. He believes, rightly or wrongly, that they are designed for users with different needs and desires than those of the typical archaeologist and that, as a result, they consume time without producing measurable help. The manufacturer of PhotoModeler (Eos Systems) says that the tutorial has been well received and would have helped with the calibration process. Perhaps so, but that does not make the on-screen choices appropriate. (Two of the tutorials have been viewed -- there is no user interaction -- since the foregoing was written. They are informative, but watching all of the tutorials provided by Eos Systems will take a great deal of time. There are eight separate tutorial presentations; the "Basic" tutorial, second of the eight provided, lasts for 40 minutes.)
The calibration complete, the next step was to prepare the experiment itself. The wall was chosen, and targets were placed on it in a grid of five (across) by four (up and down) targets. The targets were designed to provide good visibility for the CSA total station and to be appropriate for automatic location in PhotoModeler. [For more discussion of the design of the targets, see the article in this issue of the Newsletter entitled "Surveying the Northwest Wing of the Propylaea -- A Pilot Project," (http://csanet.org/newsletter/spring03/nls0301.html).] Two additional targets were placed in the foreground to provide better three-dimensional survey possibilities. All the targets were surveyed with the total station. (The data recorder is currently not working properly; so the point locations were recorded by hand.)4
 | Fig. 1 - CSA targets that can be used for both total station survey work and photogrammetry are shown here. They can be printed on clear acetate so that the white areas are transparent. The yellow background does not print strongly on clear acetate, but it helps provide contrast.
The target at upper left is appropriate as a Photogrammetry target only, and the dot in the center makes it possible to place the target precisely on the point to be surveyed. The PhotoModeler support person who has seen the target, however, believes that the clear cross-hairs are too large and may compromise PhotoModeler's ability to locate the target center automatically. (It seemed that PhotoModeler did locate target centers in the experiment, and the targets were all of this design.) The upper right target illustrates the addition of reflective tape for use of the target with a total station. This is the target used for the photogrammetry experiment. Since PhotoModeler ignores color when automatically locating the target center, the reflective tape (assuming the use of red tape, not gray or white) can be used with the target for both photogrammetry and total station surveying. The tape pieces were a bit large for the target used in the experiment, however, and seemed likely to cause some problems on occasion; so the lower right target was designed to be both larger and with smaller cross-hairs, making the area covered by the tape more clearly interior to the target while more nearly satisfying the requirements of PhotoModeler. The similar target at lower left may be used without the tape for photogrammetry only. The larger target has a diameter of 50 mm.; the smaller one 40 mm. |
The targets were used, as noted, for practical reasons. The ability of PhotoModeler to locate exactly the center of a circular target is especially valuable in this regard. Otherwise one must try visually to locate and select the individual pixel representing the target. The PhotoModeler automation is better even than accurately picking the correct pixel, though, since the center of the circle can be defined at a sub-pixel level. (Drawing two crossing lines on the image to identify the target center might also permit locating the target point more precisely, but that is not an available alternative.) Targets were also used to remove from this experiment any error that might have arisen because of confusion or misidentification of target points. Using targets made the point selection process as unambiguous as possible.
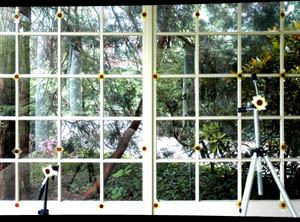
The wall (with the foreground targets) was also photographed. Photographs were taken from directly in front of the wall and from angles. The roughly head-on photographs were to be used for the initial experiment, and one of them is shown here as figure 2. The others were taken for use in pending three-dimensional experiments.
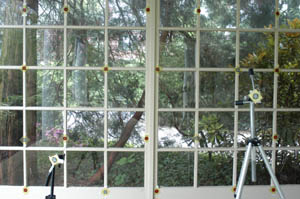
The targets were placed on the wall so that the area covered would be approximately 2 m. x 3 m. That area was chosen so that the camera, which produces 2,000-pixels x 3,008-pixels images would record approximately 1 pixel per mm. The head-on photograph used actually covered about 3.12 m. x 2.31 m.; so the final resolution was slightly less than 1 pixel per mm.
One of the photographs was chosen for use, and it was modified in an image-editing program by having the contrast heightened to make the targets more clearly visible. Since PhotoModeler has built-in tools for adjusting the image during the work process, making adjustments with another program was unnecessary. (In addition, saving the file after the adjustment stripped out some file information, making PhotoModeler warn the user that the camera selected had not really been used. The warning can be ignored, but that is not clear in the instructions.) The photo was then bought into the "project," PhotoModeler's term for a survey job, for marking. Five points in the photograph were located with the PhotoModeler process (placing a point with the mouse or permitting the center of the target to be located automatically), and the survey coordinates were entered. In anticipation of a typical project on the Propylaea, the points chosen as control points were the four outer corners of the 5-targets-by-4-targets grid as well as one of the targets near the center of the grid. (One of the targets in the foreground was also used in one experiment, but it made the results worse, not better.)
PhotoModeler then "processed" the image and data at that point to determine the camera position and aim direction. With those parameters determined -- and the camera/lens data already known -- it is possible to manipulate the photograph to create an orthographic image.5 An orthographic image of the wall was created and saved to disk.
At that point the CSA process no longer used PhotoModeler. PhotoModeler has facilities to model individual surfaces with its software, but the CSA process was simply to place the orthographic image in an AutoCAD® model for further work, as described below. Additional experiments will be undertaken with PhotoModeler's tools and reported in the next issue of the Newsletter.
When the orthographic image is produced, the user determines the horizontal line that will define the edge of the photograph. It is important to choose known points to define that line so that the image can be properly inserted into an AutoCAD model.
Although the orientation of the orthographic image is determined by a defined line in the original image, the scale of the image is not necessarily mathematically related to the real world. Scaling the image may be done when the image is used in AutoCAD with AutoCAD's tools. (The image can be scaled by PhotoModeler to match a specified number of pixels to a given unit of measurement or to create an image of specified scale at a given pixel density, but neither process would aid in importing the image into an AutoCAD model.)
Using the orthographic image to survey is easily accomplished by importing it into AutoCAD and matching the known points in the image to the surveyed locations. That is a straight-forward process involving the following procedures, but it is not one that AutoCAD novices will understand:
In this experiment the survey information from the AutoCAD model was compared to the survey information obtained from the total station. There were twenty points on the wall to be surveyed. Five of them were used to orient the image, and those points could have been directly entered into the CAD model because their coordinates were known. Only the base point, the point used to position the image, was actually used when the image was imported into the CAD model. For the sake of the experiment, therefore, the nineteen other points were located in AutoCAD by marking the image.
The coordinates of the nineteen points located via the photogrammetry process were compared to the coordinates for those same points as surveyed with the total station. The average difference between the locations of the nineteen points as surveyed with the total station and those points as surveyed with photogrammetry was .0021 m. Part of the error/discrepancy must be attributed to the photogrammetry process used in this experiment; all points are placed on a single plane, as noted above, and therefore must be in error to the extent that the wall deviates from a plane. It is possible to remove the effects of that problem and to calculate the error remaining. The average discrepancy between the two sets of survey coordinates is then reduced to .0010 m. That seems to be very good accuracy, whether considered with or without the problem introduced by the non-planar nature of the wall.
Point location is probably not the best measure of the quality of the survey results. A better measure is to compare the distances between points that result from the survey. That is, the distance from any surveyed point to any other surveyed point can be calculated, and the discrepancy between the distance derived from the total station survey and the distance derived from the photogrammetry survey can also be calculated. Such measurements from one point to another point are, after all, the standard results of architectural recording procedures and therefore represent a better view of survey reliability. Another advantage of using this method to evaluate the survey process is that it eliminates consistent bias in the data. Finally, many more examples can be compared with this method. Using the distances from each point to all other points, 190 dimensions can be calculated for the twenty points (this time including the base point, since the distance from that point to any other point involves a surveyed point as well as the base point). The 190 pairs of dimensions averaged just .001 m. different from one another. Two-thirds of the measurement pairs were within .0006 of one another. This is a very impressive set of statistics, and it suggests that using photogrammetry for a wall that is reasonably flat is a good strategy. (Virtually identical results were achieved in two separate experiments with the same data set.)
This survey technique requires considerable care if such precise results are to be obtained. In addition, experimentation before starting a project is crucial. The variables are so numerous and the conditions that affect accuracy so dependent upon the exact nature of the work that advance experiments are truly crucial. In particular, the following matters must be considered:
Some concluding words about using PhotoModeler. The program worked very well, but the camera calibration process, as noted above, needs a proper conclusion. The user must know when to stop and how to save the camera information without having to use the tutorial -- or the manufacturer must indicate that use of the tutorial is required.
The critical failing of the software, so far as this experiment showed, was the manual for explaining its use, not the software itself. Although the program's producer, Eos Systems, Inc., deserves praise for sending a complete manual in print form instead of a cheaper substitute in the form of a CD manual, the book is not up to the standards of the software. The organization of the manual is inexplicable. One member of the CSA team suggested that the manual may have been organized with a specific type of user in mind. Another, however, insisted that even someone experienced with photogrammetry software would find the manual opaque and difficult to use.
The general criticism requires some specifics.
The foregoing is not meant to be an exhaustive list of problems, just a sample. The manual needs work.
On the other hand, there are real people at the PhotoModeler office. Technical help was quick and excellent. That is so rare these days that it must be emphasized. The technical support person found an error in CSA's work by requesting that the work files be sent to him and taking the time to examine them at the Eos Systems office. Is there any other software manufacturer that will do that today?
The results were also shockingly good. CSA's work with the program has just begun, but the potential for PhotoModeler seems enormous.
1. The most sophisticated form of photogrammetry requires two photographs taken with specialized equipment and with careful advance calibration. Two images are viewed in stereo and marked simultaneously. This kind of photogrammetry is very expensive.
Return to body of text.
2. The use of PhotoModeler in underwater archaeology is described in J. Green, A. Matthews and T. Turanli, "Underwater archaeological surveying using PhotoModeler, VitualMapper: different applications for different problems," The International Journal of Underwater Archaeology 31.2 (2002) 283-92. Although some of the tables and statistics seemed unclear to readers at CSA, the overall evaluation of PhotoModeler was very postitive.
Return to body of text.
3. The camera used for this work was a Nikon D-100 digital camera with a 28 mm. lens. The 28 mm. lens was purchased for this work so that a zoom lens would not be needed. The calibration process determines the actual focal length of the lens; using a zoom lens requires the user to set the lens to the same focal length every time a photograph is taken. With a fixed-focal-length lens, that is not necessary. For less precise results, camera calibration can be by-passed.
Return to body of text.
4. The use of a total station to provide base survey data for comparison with data from the photogrammetry process may seem to imply that the total station provides certifiably accurate and precise survey data. In fact, the total station is neither infallible nor infinitely precise. The measurement of angles (both swing and elevation angles) is only accurate to the nearest 5 seconds (5/360 of one degree), and the EDM has some error potential as well. At the short distances used here and normally used for CSA's archaeological surveying, the potential for error is very small, but it is not zero even if the machine is used according to proper procedures. Therefore, the total station data used here to provide a base line must be understood to provide a set of comparisons but not necessarily a set of data to be considered an absolute standard.
Return to body of text.
5. An orthographic image is one that has been altered so that, for a single plane in space, all points on that plane will be properly related to all other points on that plane. For a wall or building, it is the equivalent of an elevation drawing.
Return to body of text.
For other Newsletter articles concerning the applications of CAD modeling in archaeology and architectural history or the Propylaea Project, consult the Subject index.
Next Article: Email File Formats: Trickier Than I Thought.
Table of Contents for the Spring, 2003 issue of the CSA Newsletter (Vol. XVI, no. 1)
 Table of Contents for all CSA Newsletter issues on the Web
| Propylaea Project Home Page |
CSA Home Page |