
| Vol. XXV, No. 3January, 2013 |
Articles in Vol. XXV, No. 3
From the sorting table to the web: The NPAP research data portal for ceramics
An extensive and inclusive database for ceramics
-- Vladimir Stissi, Jitte Waagen, and Nienke Pieters
AutoCAD® and the Resurrection of an Old Excavation
Mapping Hellenistic Gordion
-- Martin Wells
Electronic Publication — Addendum III
More in a seemingly unending series
-- Harrison Eiteljorg, II
The Blog in Academic Settings
A fad whose day has passed or . . . ?
-- Andrea Vianello
The Redford Conference in Archaeology
An excellent conference about digital technologies
-- Chris Mundigler
To comment on an article, please email
the editor using editor as the user-
name, csanet.org as the domain-name,
and the standard user@domain format.
Index of Web site and CD reviews from the Newsletter.
Limited subject index for Newsletter articles.
Direct links for articles concerning:
- the ADAP and digital archiving
- CAD modeling in archaeology and architectural history
- GIS in archaeology and architectural history
- the CSA archives
- electronic publishing
- use and design of databases
- the "CSA CAD Layer Naming Convention"
- Pompeii
- pottery profiles and capacity calculations
- The CSA Propylaea Project
- CSA/ADAP projects
- electronic media in the humanities
- Linux on the desktop
Search all newsletter articles.
(Using Google® advanced search
page with CSA Newsletter limit
already set.)
AutoCAD® and the Resurrection of an Old Excavation
Martin Wells
(See email contacts page for the author's email address.)
Introduction
The site of Gordion is located in what is today the western part of central Turkey (fig. 1). In antiquity, it was a major city that reached its height from the tenth through the eighth centuries BCE as the capital of the Phrygian empire and the home of the legendary King Midas. In 1950 Rodney Young of the University of Pennsylvania began large-scale excavations there that continued for 17 seasons until his death in 1974. He and his team documented occupation at the site from the Late Bronze Age through the early Roman Imperial period, with the most architecturally impressive remains coming from the Early Phrygian citadel: a monumental gate, a series of royal halls, and multiple work and store rooms (fig. 2).
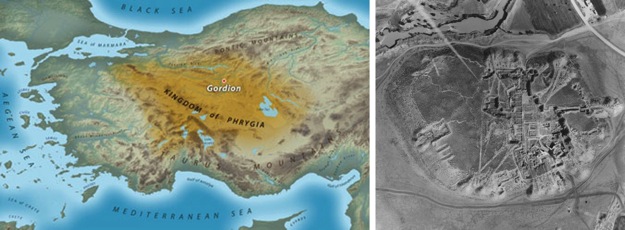
Figure 1. Map of central Anatolia and view of the site (sites.museum.upenn.edu/gordion; courtesy Gordion Archives)
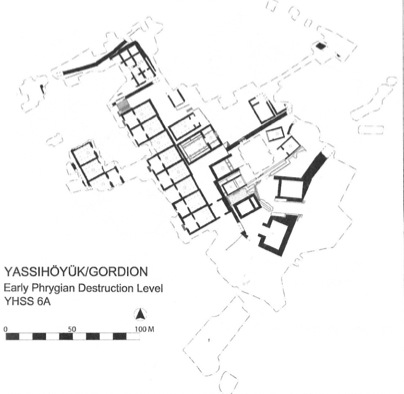
Figure 2. The Early Phrygian Citadel
(Voigt, M. M. 2005. "Old Problems and New Solutions: Recent Excavations at Gordion" in
The Archaeology of Midas and the Phrygians: Recent Work at Gordion, edited by
L. Kealhofer. Philadelphia: University of Pennsylvania Museum: 22-35; figure 3-3)
The history of ancient Gordion did not end with King Midas. The city reappears in the historical record some five centuries later as the place where Alexander the Great cut the famous Gordian Knot in 333 BCE, assuring his ascension to the Persian throne. The geographer Strabo (12.5) reports that Celtic tribes from Europe, the Galatians, settled in this area, and the Roman historian Livy (38.18) says that at the beginning of the 2nd century BCE, Gordion was not a large town, but a well-known and frequented market.
It was not until the Young excavations that we knew anything else about the settlement at Gordion during the period following Alexander’s visit. Young's team found Hellenistic-period remains across 20,000 square meters of the upper levels of the site. These remains included individual homes filled with the accoutrements of everyday life. We also have evidence of cottage industries in small domestic workshops. It was quite clear that the architectural character of the settlement had changed. The monumental structures and fortifications of the Phrygian state capital, many having been quarried for construction materials, stood only as foundations or were buried. An unwalled, modest, yet prosperous, village-style community had risen on the remains of the Phrygian citadel. What is more, and what all archaeologists would like to encounter but very rarely do, the houses and other structures were incredibly well-preserved. The residents abandoned their homes and fled the site in 189 BCE at the approach of the Roman legions. The portion of the Hellenistic settlement Young excavated was never reoccupied. The structures were more or less left to the elements and occasional looting for the next two millennia.
Publication
Young never published the Hellenistic material. His site architects drew a few formal plans, but most of the architecture was never thoroughly recorded. A complete state plan was never assembled. The plans that were drawn were never analyzed or studied. These existing plans, along with the excavation notebooks and photographs, are the only evidence of the Hellenistic architecture. The excavation records remained in storage until 2003 when I took on the project of digitally reconstructing the settlement for my dissertation (Wells, M., A Cosmopolitan Village: The Hellenistic Settlement at Gordion. University of Minnesota, Ph.D. Dissertation, 2012.). It was at the beginning of my graduate training, and I was interested in computer architectural applications and field archaeology. The Gordion material, while daunting in its chronological and stratigraphic scope, appeared to be well-suited for this approach.
The Process
My first step was to scan all the plans depicting Hellenistic remains. These included the formal plans mentioned above plus all preliminary plans, field drafts and notebook top plans. The largest group was of those plans drawn by the site architects. These covered approximately 60% of the excavated area. There were over 160 of them with varying degrees of detail. Some depicted one architectural phase or stratigraphic level, some as many as three phases or four strata. On most of the multiphase plans, there were no indications of which walls were assigned to which phase. Many of the plans were labeled with the trench name and contained a north arrow; a few contained none of this information. Regardless of the state of the plan, I scanned them all and organized them into folders by trenches when the trench name was supplied.The smaller group of plans was that of the top plans drawn by the individual supervisors in their excavation notebooks. One hundred thirty-two notebooks contained the day-to-day records of the excavation of the Hellenistic levels. I went through each of these and scanned top plans for trenches that had not been drawn by the site architects, i.e., the remaining 40% of the excavated area. These plans also varied in detail and clarity, ranging from quick sketches to full stone-by-stone drawings at scale.
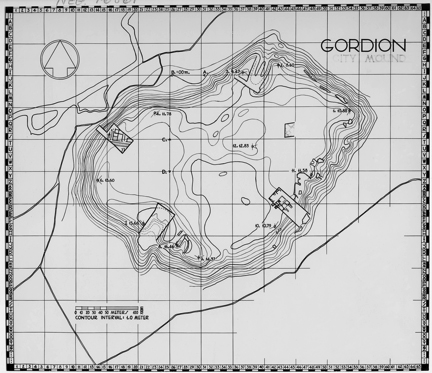
Figure 3. Topographic plan of the mound with Young’s first trenches.
(Courtesy Gordion Archives).
Mapping
Once the plans were scanned, I began the process of digitizing, mapping and putting the state plan of the settlement together. My first starting point was the plan drawn of the site at the end of the first season of excavation in 1950 (fig. 3). This showed the topographic contours of the mound and the locations of the first four trenches that Young opened.1 Excavation continued around the two easternmost trenches, making them secure reference points upon which to anchor my second starting point, the digital plan of nearly all of Young’s trenches. Other Gordion scholars had assembled this some years earlier as a very basic reference for the location of the trenches.
The process of putting these together was straightforward. I imported the contour plan as a raster file into AutoCAD (version 2002) and digitized it, scaled it and locked it as the base layer, ContourPlan. I then brought in the digital trench plan file as another layer, TrenchPlan, matched up the original two trenches on both plans and locked that layer. I then had a digital master plan of the mound showing Young’s trenches in the correct locations (fig. 4). This was the digital space into which I drew and placed the architecture from all the trenches.
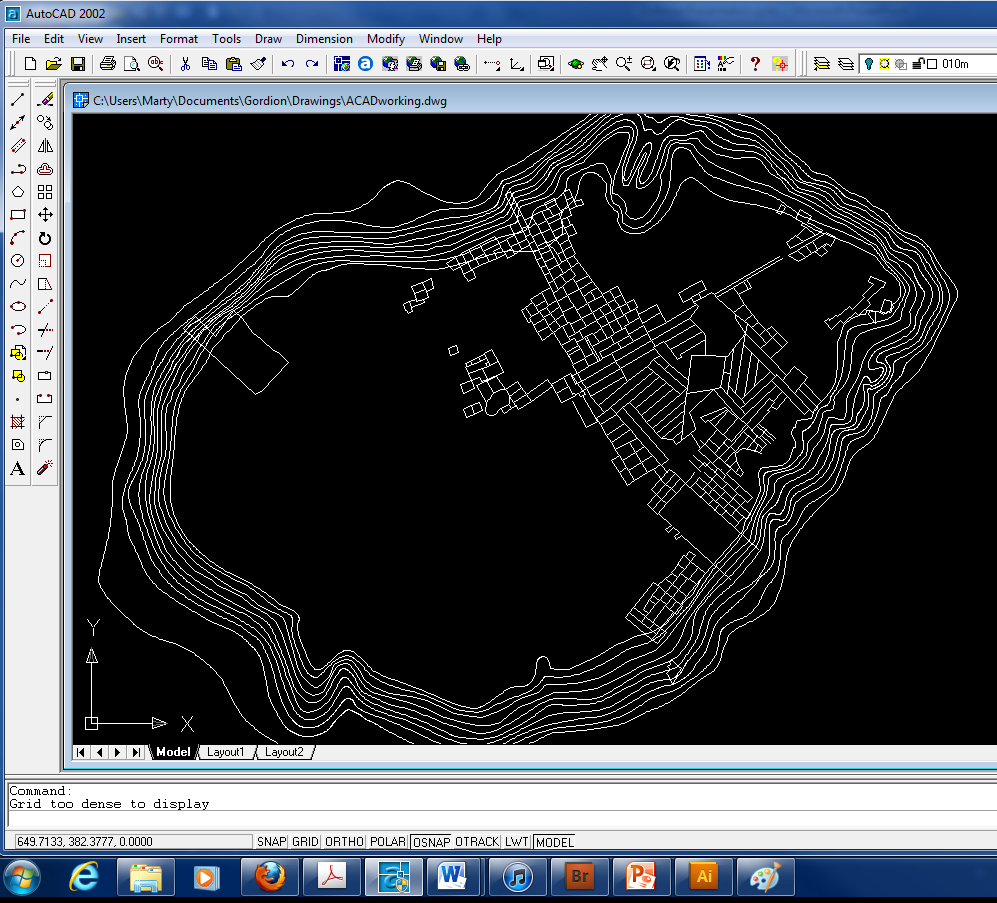
Figure 4. Digitized topographic plan of the mound with
Young’s trenches. (Wells 2012, fig. 19)
I worked trench by trench to fill in the master. In the beginning, I simply drew the new architecture directly on the master, making a new layer for each trench. For example, all the architecture on plan for the NCT-A4 Trench was drawn on one layer with that designation. If there were separate levels or phases on a plan, each would be assigned to its own layer. For example, SET Level 1 would be a layer and SET Level 2 would be another layer. Later, when my understanding of AutoCAD functions improved, I drew the trenches as separate files and imported them into the master as blocks. This seemed to go faster, and I could make corrections or adjustments more quickly than working within the master itself.
The mapping went easiest when the originals included trench lines. In those cases, I was able to place the walls or structures on the master plan of Young’s trenches with no problems. Work went this smoothly about half of the time. Otherwise, when the plans were unlabeled, finding their correct locations on the site involved equal parts incredible luck and painstaking detective work. I browsed through the notebooks for contextual and stratigraphic information, all the while hoping for a sketch plan (not always included). If there happened to be a simple sketch of walls, that particular arrangement might trigger a recollection of something I had seen earlier on one of the architects’ plans. If they were indeed the same walls, I then knew to which trench the plan referred (fig. 5). Then I could look at other plans with many trenches to see if those particular walls showed up on those plans. The photographs helped as well in that the most important piece of information may not have been the wall that was the subject of the photograph, but the walls in the background. Those walls reminded me of walls I had seen either in plans or notebooks, just like the notebook sketches.
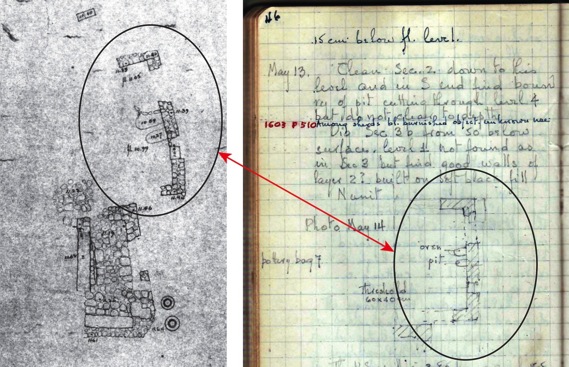
Figure 5. Link between unlabeled plan (left) and sketch plan in notebook (right)
(courtesy Gordion Archives; Wells 2012, fig. 22)
The notebook top plans made the process a bit more difficult. Again, Young’s architects only drew the architecture for about 60% of the excavated area. It was up to the supervisors of the remaining trenches to sketch what they could in their notebooks. In reconstructing this portion of the site’s architecture, the more detail the excavators provided in terms of lengths, widths and distances, the more accurate I could make the digital plan. A common problem was that two or more people might have excavated a given structure over a span of days or even years. On those occasions, the result was a plan for a single structure that was broken up and drawn on separate pages, at different scales and with different degrees of attention to detail (fig. 6). In those cases I took the approach of making the best guess at the reconstruction from all of the available evidence. I imported all the plans for one structure into AutoCAD and scaled them appropriately and then digitized them. The notes and photographs were often helpful in those cases for the details such as the size of paving stones or the presence of stucco on the mudbrick walls.
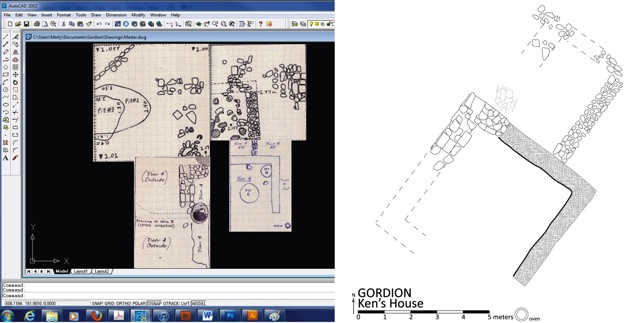
Figure 6. Assembled notebook sketches of a single house plan (left)
and digitally rendered reconstructed house (right) (courtesy Gordion
Archives; Wells 2012, fig. 23)
Phasing
Young’s team opened over 200 trenches during their 17 seasons of excavation. During this time, there was never a standard phasing or stratigraphic system in place for the excavators to use when recording their findings. The result was that each trench supervisor labeled his or her architecture according to how he or she understood the stratigraphy. One supervisor might record her findings according to architectural phases. Another might make designations based on floor or surface level. The majority of supervisors acted independently, rarely matching up their levels or phases with those in neighboring trenches.
Faced with this situation, I thought it best to finish the state plan of all Hellenistic material first before trying to assign phases to the architecture. This way, I could get the entire picture of what the site looked like architecturally. I worked through the notebooks and got a sense of the overall stratigraphy of the settlement and what scale of phasing was going to be possible.
I was able to discern two major occupational phases to the settlement, an Early Hellenistic phase (c. 333 – c.270 BCE) and a Middle Hellenistic phase (c.270/240 – 189 BCE). These phases coincided with the ceramic chronology of the site that had been established by Shannan Stewart, the scholar who studied and published the Hellenistic pottery at Gordion (Stewart, S.M., Gordion After the Knot: Hellenistic Pottery and Culture. (University of Cincinnati, Ph. D. Dissertation, 2010.). I returned to the digital master plan, by then with all the Hellenistic architecture on it, and reorganized. I created two new layers, EarlyHell and MiddleHell, and assigned each of the old layers to one of the new ones. The result was a state plan of the settlement with only two layers corresponding to the two occupational phases (fig. 7).
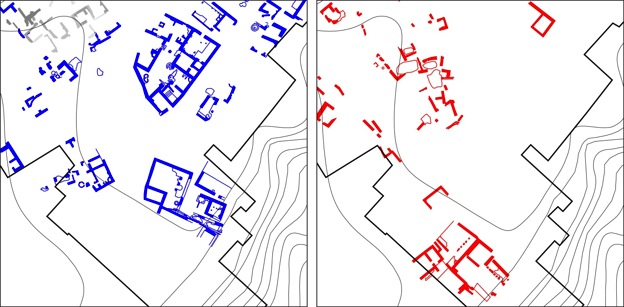
Figure 7. Selections of the Early Hellenistic (left) and
Middle Hellenistic (right) state plans from the same part of the mound.
The grey walls on the Early Hellenistic plan are walls of uncertain
date, but probably Early. (Wells 2012, figs. 5 and 6)
Lessons
I started this project not knowing anything about using AutoCAD except that it seemed that it was going to be the only way to put the puzzle of Hellenistic Gordion together. There was too much information and there were too many plans to do it any other way. So I taught myself what I thought were the necessary functions in AutoCAD to get the job done. I bought a manual (Stellman, T.A. and G.V. Krishnan, Harnessing AutoCAD 2002 (Autodesk Press, 2002.), and that helped a great deal in getting familiar with the AutoCAD workspace and knowing what commands I needed to complete a given task.
I made a great many mistakes along the way. Most of them were simply doing things the long way or the hard way. For example, I think that adding new layers onto the master plan for each trench was not the best thing to do. In the end, there were hundreds of layers. If I wanted to work on just one area, I still had to open up the whole plan. I often found myself making errant keystrokes or mouse movements, selecting objects I did not intend to, and moving them because I had forgotten to lock the layer to prevent accidental changes. I think now I would do first what I did in the later stages and make separate files for each trench. I could work on them individually and then place them on the master when everything was finished. Using layers to differentiate between parts of the plan with high-quality data sources (the architects' drawings) and those with lower quality sources (the supervisors' notebook sketches) would also have been helpful for readers and for me. There was also a great deal of trial and error in figuring out how to get a section of the plan into a format ready for annotation or printing. I found the AutoCAD text boxes to be too restrictive as to placement and the process generally too time-consuming. It was only later that I realized that Adobe Illustrator® could open the native AutoCAD files. Once the drawings were in Illustrator, I was able to annotate them, add shading or hatching and convert them to files suitable for inserting into Word documents or Powerpoint presentations.
I suppose that this project would have been possible just using Illustrator, since that program also functions with layers. But AutoCAD proves the better program for many reasons. For example, the learning curve for this kind of digitizing and reconstruction work is fairly gradual. Data on dimensions and distances are immediately available. The program gives the user the ability to move in seconds from an overall view of the entire site (hundreds of meters) to a detail view of the cuttings on a threshold block (centimeters). The digitally created spaces are easily accessed and manipulated, allowing the user to move through the architecture. Given the massive amount of information and the stratigraphic and geographic scope of the area, AutoCAD was the only choice.
-- Martin Wells
Notes:
1. Five trenches appear on the plan. The northernmost trench was from the Körte brothers’ excavation in 1900. The plan also depicts the excavation grid that was established in the first season but never used or referenced in later seasons. Return to text.
All articles in the CSA Newsletter are reviewed by the staff. All are published with no intention of future change(s) and are maintained at the CSA website. Changes (other than corrections of typos or similar errors) will rarely be made after publication. If any such change is made, it will be made so as to permit both the original text and the change to be determined.
Comments concerning articles are welcome, and comments, questions, concerns, and author responses will be published in separate commentary pages, as noted on the Newsletter home page.