
| Vol. XXIV, No. 2 | September, 2011 |
Articles in Vol. XXIV, No. 2
Project Publication on the Web — III
Organizing and planning the work.
-- Andrea Vianello, Intute, and Harrison Eiteljorg, II
Photofly from Autodesk - 3D from Photos
Experimental software for making 3D models.
-- Harrison Eiteljorg, II
Project Publication on the Web — IV
The final publications.
-- Andrea Vianello, Intute, and Harrison Eiteljorg, II
Website Review: The British Museum Ancient Civilization Sites for Young People
Superb introductions to ancient civilizations.
-- Phoebe A. Sheftel
Website Review: CyArk
Much potential and many problems.
-- Andrea Vianello
Miscellaneous News Items
An irregular feature.
To comment on an article, please email
the editor using editor as the user-
name, csanet.org as the domain-name,
and the standard user@domain format.
Index of Web site and CD reviews from the Newsletter.
Limited subject index for Newsletter articles.
Direct links for articles concerning:
- the ADAP and digital archiving
- CAD modeling in archaeology and architectural history
- GIS in archaeology and architectural history
- the CSA archives
- electronic publishing
- use and design of databases
- the "CSA CAD Layer Naming Convention"
- Pompeii
- pottery profiles and capacity calculations
- The CSA Propylaea Project
- CSA/ADAP projects
- electronic media in the humanities
- Linux on the desktop
Photofly from Autodesk - 3D from Photos
Harrison Eiteljorg, II
(See email contacts page for the author's email address.)
Readers of the CSA Newsletter may recall various experiments to help with surveying needs in the course of the CSA Propylaea Project. One such experiment was with the computer program called PhotoModeler®. The program was used in an attempt to obtain survey data (x-, y-, and z- coordinates of block corners) for the purpose of creating 3D models of blocks in the NW wing of the Propylaea. (See "Surveying with Photographs — PhotoModeler® 5; Spring, 2003; XVI,1; and "More Survey Experiments on the Propylaea;" Fall, 2003; XVI,2. Both articles were written by the present author.) The program relied upon the use of multiple photographs of a given area and the application of photogrammetric algorithms to those photographs. The results were unsatisfactory because it was not possible reliably to locate the same points in multiple photographs; nor was it possible to use rectified views (equivalent to direct, head-on views of the subject with no perspective effects) to compensate for the inability to locate common points. Multi-image photogrammetry, however, remains a potentially valuable tool for use by archaeologists in need of survey data, albeit not the right tool for use on Athenian cut-stone building where extreme levels of precision are required. If and when better programs are available to provide the survey data in the form of real x-, y-, and z-coordinates from photographs, there will be many eager users. (One of the truly compelling advantages of photogrammetry is the potential to go back to points of interest — the photographs, not the place — to obtain more data long after the necessary work has been completed. Anything in the photos could be surveyed years later; by comparison, any standard survey work with a transit or one of its electronic descendants requires that the user get all the information the first time. Generally speaking, there will not be a second time.)
Autodesk, the company that produces AutoCAD, has recently released a new program that uses photogrammetric approaches to create 3D models from photographs; it is available for experimental use with free downloads provided via the Autodesk website. There is no charge for downloading the program. (Autodesk seems not to use the word photogrammetry in their discussions, but it is clear that the underlying mathematics do rely on the ideas of photogrammetry.) The new program, called Photofly came to my attention via a NY Times article, "Photofly Brings 3-D Models to the Masses," by Jennifer 8. [sic] Lee, posted July 14, 2011. Ms. Lee states that the system uses stereo photogrammetry. (I should note that Autodesk refers to Project Photofly and calls the program that is used on a PC "Photo Scene Editor." In the following, I will use Photofly is both the program name and the process name.)
I tried the program with the photographs used in our original experiments for PhotoModeler in 2003 to see what capabilities it might bring to archaeological work. The program was operated on the CSA MAC computer running Parallels so that Windows could operate. All work with Photofly was done using Windows; no MAC version of the software is available. (The program was operated on a MAC running OS X 10.7 — "Lion" — using Parallels 6 and Windows NT.)
The process of creating a 3D model is relatively easy. Twelve photographs of the eastern portion of the north wall of the NW wing (most with a bit of the east wall as well) were used. They were high-resolution images (3008 x 2000 pixels), good enough for use in PhotoModeler to make very fine discriminations.
The Photofly process started with the selection of the photographs, all of which were automatically uploaded to the Autodesk site. The 3D model was produced on the Autodesk site in the sense that computers there analyzed the photographs, determined the origin point, principle axis, and focal length for each (I assume), and returned that information to the local computer. (The photographs need to remain on the user's computer; they are used by the program.) The process was relatively quick and required no input from me. It was not necessary for me to provide any information at all, just the images.
The result, seen here in figs. 1-3, is very impressive. The model — it is a model, not a photograph, as the three images from different vantage points should make clear — is an excellent representation of the corner of the NW wing of the Propylaea. Before I could experiment further to determine the potential of the system for finding measurements, though, I had to have more information.
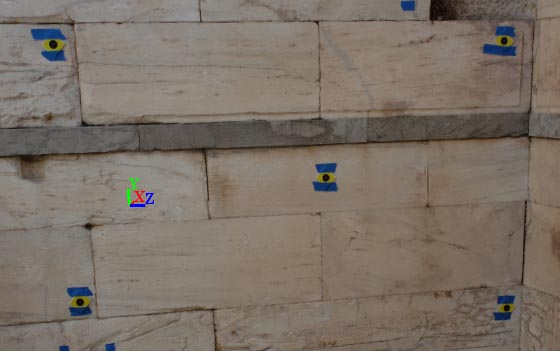
Fig. 1 - A view of the 3D model of the NE corner of the NW wing of the
Propylaea, created by Photofly. (Small icon showing principal axes included.)
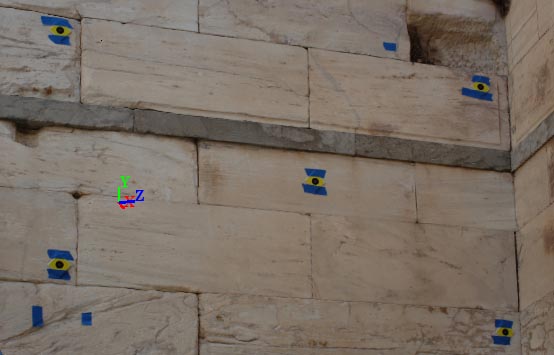
Fig. 2 - A second view of the same 3D model of the NE corner of the
NW wing of the Propylaea, created by Photofly. (Small icon showing
principal axes included.)
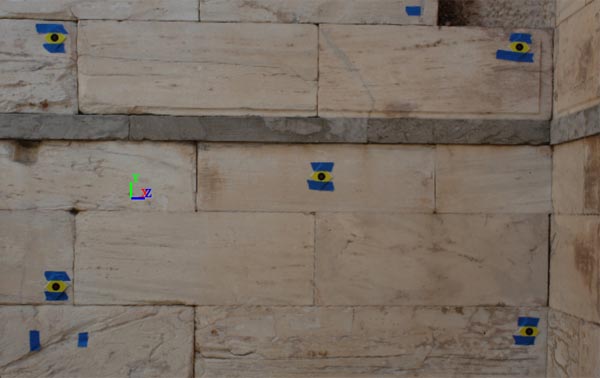
Fig. 3 - A third view of the same 3D model of the NE corner of the
NW wing of the Propylaea, created by Photofly. (Small icon showing
principal axes included.)
I said it was not necessary to provide any information at all. That is true so long as one wants only the image(s) from the model, as shown above. If dimensional information is desired, as in surveying, there is some information that is required. In fact, fitting the model into a properly oriented and dimensioned 3D world is difficult and demanding. The process at the computer is not so difficult, but the process before and during the photo session is very demanding and laborious. This requires a thorough explanation, but, before providing that, I must point out that the information in or about the photos of the Propylaea was not satisfactory to permit using those photos further in Photofly. Without the information required by Photofly this model could not be oriented or scaled with any reasonable precision.
In order to orient the photos — and the model — correctly in 3D space, Photofly must know the orientation of two of the three axes (X-, Y-, and Z-) and the 0,0,0 point. Unfortunately, the way the system functions requires that the 0,0,0 point be a point in the photos, one the user can identify visually. Identifying two of the three axes is not quite so onerous, but much depends on the level of accuracy and precision one needs to achieve. Oddly, well-surveyed points in the scene are of no value for orientation purposes, though they may be used for scaling.1
Once the photographs have been coordinated and the 3D model generated, the user must pick out the 0,0,0 point and then define two of the three axes by selecting points that can provide the information required (e.g., two points on the x-axis). Following that, the user must pick two points (which may include points already defined) and indicate the distance between them to scale the model. Then and only then may any dimensional questions be asked. That is, only after orienting and scaling the model can dimensional information be retrieved. This is hardly a surprise. The system needs the information about both orientation and scale in order to identify point locations. The surprise is that the system cannot orient and scale the model with surveyed information about more or less random points in the photos. The photos taken for use with PhotoModeler are not adequate, for instance, even though targets created for orientation and scale had been placed in the photos and surveyed with considerable care. There is no identifiable point in the photographs that can be called the 0,0,0 point, and there is no way to define the axes of the survey system used there (or even some other axial information) with any precision. Thus, the orientation cannot be carried out. (As noted above, however, the surveyed points could be used to provide point-to-point distances for scaling.)
The scaling also has some drawbacks. The points used to determine scale cannot be more than 1000 units apart (the size of the unit does not matter), and the precision available will be to the nearest unit.2 Thus, a scale distance of 1 m. may be called 1000 units (mm. in this case), making mm. precision theoretically possible. But a longer distance between scaled points, say 1000 m., could also be entered as 1000 units (m. in this case), reducing the potential precision to plus/minus 1 m. (Those more mathematically oriented may object to the vagueness of that discussion. The only hard information I had was that the measurement could not be more than 1000 units. Everything else in the foregoing has been deduced from that.)
In practice, this means that attempting to use this program to make measurements requires a great deal of care in setting up a carefully defined grid in the photo scene. That is, there must be unambiguous, clear, identifiable points at the 0,0,0 point and any other points to be used for orientation or scaling.3 In addition, precision is restricted by the limit discussed above on the distance between reference points for scaling. The shorter the distance used for scaling, the less precise the scaling process.
It should be noted that the axes do not need to be related to anything in the real world, though the scale needs to be accurate. That is, real-world survey points can be used to relate the various model parts to one another — and to a standard coordinate system — when they are ultimately connected at the end of the day. The orientation of the model, relative to the real world, will not impact the results so long as the axes defined are truly perpendicular to one another.
Thus, there must be well-defined points, but those points cannot be simply determined with advance survey work in some independent survey grid. They must be precisely related to one another and to independent survey data. That is, I cannot simply post some targets, survey them, photograph the scene, and then use the targets to orient and scale the scene if I want to connect the model thus created to any other model. The targets must be precisely located in a defined grid system that places the 0,0,0 point in the photographs. For instance, assuming a subject such as the Propylaea, many sets of photographs would be required to cover the entire building. And each set of photographs would require not only the carefully placed targets to provide the 0,0,0 point and the orientation (and scale) but also points in some overall standard survey grid so that each set of photographs could, at some point in the process, be connected to each other set.
In addition, the targets must not obscure important points in the photographs (either points of survey interest or points required to orient and scale the photographs), and they must be clearly visible from any angle.
To test this system a simple experiment was carried out. A corner of a room in my house was selected as the subject area. On vertical surfaces, mostly windows, were placed many copies of a paper target with three crosses on each target and with known measurements between crosses. (See fig. 4 for the experimental set-up.4)
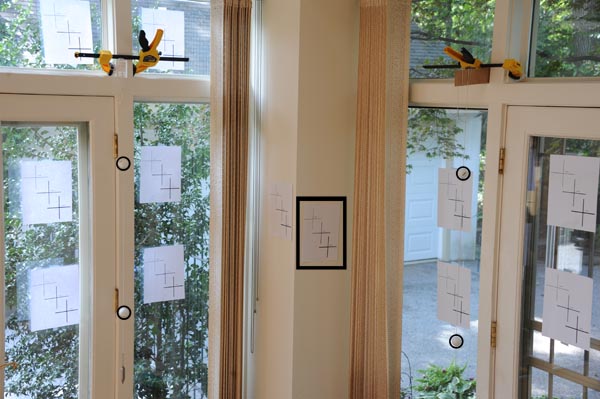
Fig. 4 - The set-up for Photofly experiment.
Note that ping-pong balls serving as orientation and scaling
targets are in dark circles. Similarly, one printed target is in a
dark rectangle. These added indicators do not show in the original
photograph, available here at full-size.
In addition, strings with plumb bobs were suspended in two places so that ping-pong balls placed on the strings could be used for orientation and scaling. Two of the balls were located at the same elevation (with the aid of a carpenter's level), and the distance between was measured, with the intent that the centers of those two balls would define the X-axis. A second ping-pong ball was placed on each string above the ones defining the X-axis, and the distances between centers of each pair of balls on a given string were measured. These targets (all spherical so that centers could be found from any point of view) provided ample information for orientation and scale. (It should be noted that this system would not function in the out-of-doors. Wind would move the strings, and it would be impossible to keep the ping-pong balls still.)5
The resulting area of interest was about 3 meters across, with about 2 meters of each of the two perpendicular walls in view. Sixteen photographs were taken of the area from a variety of angles. A zoom lens on a Nikon D3X camera was used, set at approximately 50 mm. focal length for these photographs and changed little if any. An ISO setting of 400 was used to improve depth-of-field, and the photographs were all taken with an aperture of about f/6.3 and a shutter speed of about 1/60 of a second. JPEG images of 4256 x 2832 pixels were obtained and loaded into the Autodesk software.
The photographs were uploaded to the Autodesk servers, processed, and analyzed. The necessary information was returned to the computer so that the model could be displayed. The model was then oriented and scaled. (I had not known about the distance limit between the two points used for scaling and had intended to use the two ping-pong balls on the X-axis to scale the model. They were 1.5345 m. apart, but that distance was too great to be used. The two ping-pong balls to the right, however, were 722 mm. apart. They were used for scaling.)
The distances between the two ping-pong balls on the left string and the two at the same elevation were then requested from the Photofly system. According to the system, the distance between the two balls on the left string (measured as 698 mm.) was 696.46 mm., and the distance between the two ping-pong balls at the same elevation (measured as 1534.5 mm.) was 1529.23 mm.
I then asked the system for the distances between two of the three crosses on the targets that had been placed on the walls. I picked the centers of the top and bottom crosses on each target. The measured distance between the crosses was 172 mm.
The reported distances were as follows: 173.32, 169.05, 171.08, 167.18, 171.96, 170.26, 177.19, 171.83, 171.24, and 170.56 mm. The average of these measurements is 171.37, and that would seem to provide confirmation that the system works well, but we cannot obtain real-world survey points by taking many measurements and averaging; the system might permit that, but it would provide only a dimension. What we need, however, is survey data, the x-, y-, and z- coordinates of various points in the real world. Photofly is not set up to let us accomplish that directly, and multiple selections, averaged, would not provide a useful route to the data. Therefore, a more useful examination of the obtained results would point out that the range is from a low of 167.18 to a high of 177.19 mm. That is a range of about a centimeter. That, in fact, is a very good result in this case, and I would be willing to use this software if I were looking for that level of precision — to the nearest cm. — and if I were working on an area of comparable size.
Having learned something about how to use the software, I thought it would be useful to try more dimensions; so I checked more distances from cross-to-cross on the targets, this time choosing the two shorter distances on each target (as opposed to the single longer distance used in the first experiment).
The upper dimension (the distance from the top cross to the middle one) had been measured as 89.5 mm. The measurements supplied by the system were as follows for the ten targets used: 90.17, 87.47, 88.01, 83.47, 91.45, 88.56, 92.93, 90.39, 87.66, and 90.45.
The distance from the middle cross to the lower one had been measured as 83 mm. The measurements supplied by the system were as follows: 83.7, 81.92, 83.09, 83.88, 80.60, 82.16, 84.95, 82.26, 83.74, and 80.51.
Again the averages seem to suggest good accuracy and precision. The average for the upper distance, measured as 89.5 mm., was 89.06. The average for the lower distance, measured as 83 mm., was 82.7. Those would be extremely impressive but for the fact that, once again, averages are not the issue. The variation, from a high of 92.93 to a low of 83.47 for the upper distance and from 84.95 to 80.51 for the lower distance again suggest that a 1 cm. level of precision is the result with this technology in the current iteration.
But wait! That level of precision does seem to be achievable in this experimental setting, but we had an area only about three meters across. As the area under study grows, the precision decreases. So if the area under study were, for instance, 30 meters across, I would expect precision to about 10 cm. The relationship should be more or less linear; so a 300 m. area might yield precision to the meter. This limits matters considerably, though it is not appreciably different from any use of photogrammetry; the effective resolution of the photographs and one's ability to pick out details changes dramatically as the coverage changes. (At this point I should note that the Photofly facility provided for precise marking of points of interest in the photos/model was, for me, all but useless. That may have been the result of my hybrid system of MAC running Parallels running Windows, but it was very frustrating.)
As with PhotoModeler, there are some additional caveats. Being sure that one has found the right spot for surveying is easier in this system than in PhotoModeler; you can pick the point you want in a single view and have that point identified in all views by the software. The problem is that the identification may not be precise in all views. In fact, I regularly located a point in one view and then needed adjust its position slightly in other views. (This was not only true for the ping-pong balls but also for the crosses on the targets used to check the measurements.) If the user is dependent upon making those adjustments by eye, as I was, the ability to see the point of interest in multiple photographs is as critical here as in PhotoModeler. There is also here the need to sew together a variety of scenes by using surveyed points from each to move and rotate the models ultimately so as to get all models in the same orientation. This is also necessary with PhotoModeler, but PhotoModeler can make do with survey data that orients all images to the real world from the beginning. In addition, PhotoModeler does not require the laborious orientation and scaling processes that Photofly requires.
Photofly also has an important and potentially valuable benefit from its Autodesk heritage. The user may draw in Photofly &mdash lines and connected lines — and export those lines to AutoCAD as part of a model. The ends of the lines. of course, may provide real survey data; the x-, y-, and z-coordinates of the ends of the lines can be obtained easily in AutoCAD. In short, a user could draw lines and connected groups of lines in Photofly, export the results to AutoCAD (along with surveyed points for orienting the model to the real world), and then have a 3d-correct model. The results might not be as precise as required for some purposes, but the lines would be correctly oriented in their worlds. That is a huge advantage over other approaches to harnessing 3D photogrammetry to make models.
In the end, Photofly is a product in process. Where and how it changes from here will depend greatly on Autodesk's views of the potential users. If the company sees users as wanting 3D models for visual use only, the survey potential may not be developed. If, on the other hand, surveying from photographs is seen as important by the company, development may progress quite differently. The software is certainly competent; its utility for archaeological surveying remains to be proved.
-- Harrison Eiteljorg, II
Notes:
1. The distance between surveyed points is quite easy to calculate; one needs only the x-, y-, and z-coordinates for each of the points. Not being able to use surveyed points for orientation must reflect the aims of the software development team since the math should make it possible to orient and scale the model with a relatively small number of surveyed points and x, y, and z-coordinates, regardless of the 0,0,0 point. Return to text.
2. That level of precision is implied by the way the system accepts the distance from point to point for scaling. A distance between points of 1000.00 is acceptable, but not 1000.01, 1000.10, or 1001. Various other accepted and rejected possibilities make it seem that I may not have fully fathomed the limits and their implications here. Return to text.
3. More casual point choices would still produce a model that could be queried, but precise, accurate information requires considerable care in creating the base points. Return to text.
4. The result was not as good visually as the result from the Propylaea photos. All the glass areas were poorly defined, making the whole scene appear less well-defined. I attempted another experiment using a simple white wall as the major background. The plain wall, however, yielded results similar to the glass, and the absence of a corner — though objects were placed in the foreground to provide some visual depth to the scene — seemed to make the results no better. It seems that better visual results — not necessarily better survey results — will be produced from scenes with complex 3d geometry and without plain, flat surfaces. I considered trying to find such a setting, but it seemed that no appropriate setting was both available and subject to the use of careful, controlled data-point locations — suggesting again how hard it would be to put this software to effective use for precise surveying of archaeological materials. Return to text.
5. The system was more capable than I expected, and selecting the visual center of a ping-pong ball in one view did not yield the center in other views. Rather, the software found, or tried to find, the same point on the sphere. Therefore, I adjusted the locations of the centers of the ping-pong balls on all views so that the centers of the ping-pong balls, regardless of point of view, were selected. It is conceivable that this process is not ideal for the software capabilities, but mathematically it should work since it places all the points on rays that should intersect at a single, identifiable point in space. If something smaller would be better, there would remain a limit on size. Whatever is used must be large and discrete enough to be identified securely in all photographs, regardless of point of view. Return to text.
All articles in the CSA Newsletter are reviewed by the staff. All are published with no intention of future change(s) and are maintained at the CSA website. Changes (other than corrections of typos or similar errors) will rarely be made after publication. If any such change is made, it will be made so as to permit both the original text and the change to be determined.
Comments concerning articles are welcome, and comments, questions, concerns, and author responses will be published in separate commentary pages, as noted on the Newsletter home page.